


To view data for every Essex County town, go to: http://www.sullivanteam.com/Properties/Reports/Public/Charts.php
To dowload the full Housing Report go to: http://sullivanteam.com/pages/EssexCountyHousingReports
|
To view data for every Essex County town, go to: http://www.sullivanteam.com/Properties/Reports/Public/Charts.php
To dowload the full Housing Report go to: http://sullivanteam.com/pages/EssexCountyHousingReports

To view data for every Essex County town, go to: http://www.sullivanteam.com/Properties/Reports/Public/Charts.php
To dowload the full Housing Report go to: http://sullivanteam.com/pages/EssexCountyHousingReports

To view data for every Essex County town, go to: http://www.sullivanteam.com/Properties/Reports/Public/Charts.php
To dowload the full Housing Report go to: http://sullivanteam.com/pages/EssexCountyHousingReports

To view data for every Essex County town, go to: http://www.sullivanteam.com/Properties/Reports/Public/Charts.php
To dowload the full Housing Report go to: http://sullivanteam.com/pages/EssexCountyHousingReports

To view data for every Essex County town, go to: http://www.sullivanteam.com/Properties/Reports/Public/Charts.php
To dowload the full Housing Report go to: http://sullivanteam.com/pages/EssexCountyHousingReports

To view data for every Essex County town, go to: http://www.sullivanteam.com/Properties/Reports/Public/Charts.php
To dowload the full Housing Report go to: http://sullivanteam.com/pages/EssexCountyHousingReports

To view data for every Essex County town, go to: http://www.sullivanteam.com/Properties/Reports/Public/Charts.php
To dowload the full Housing Report go to: http://sullivanteam.com/pages/EssexCountyHousingReports

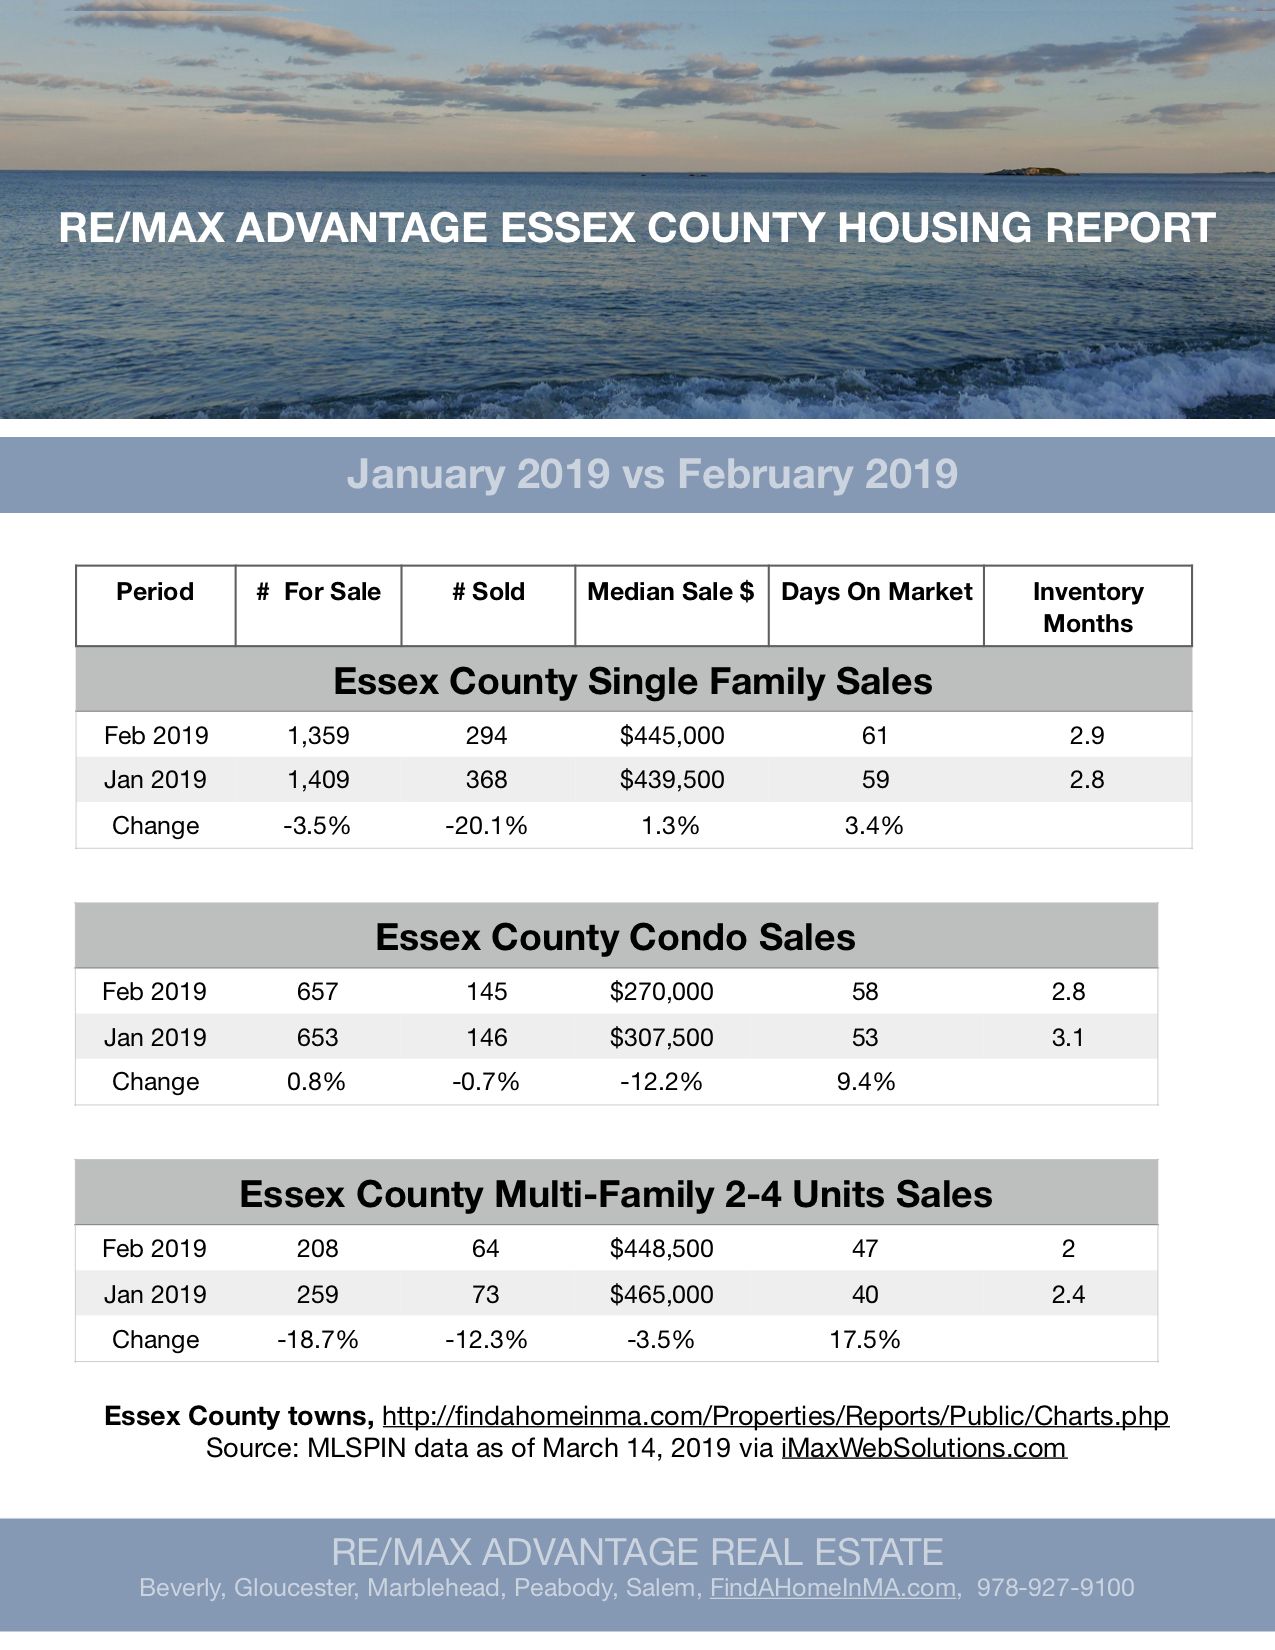
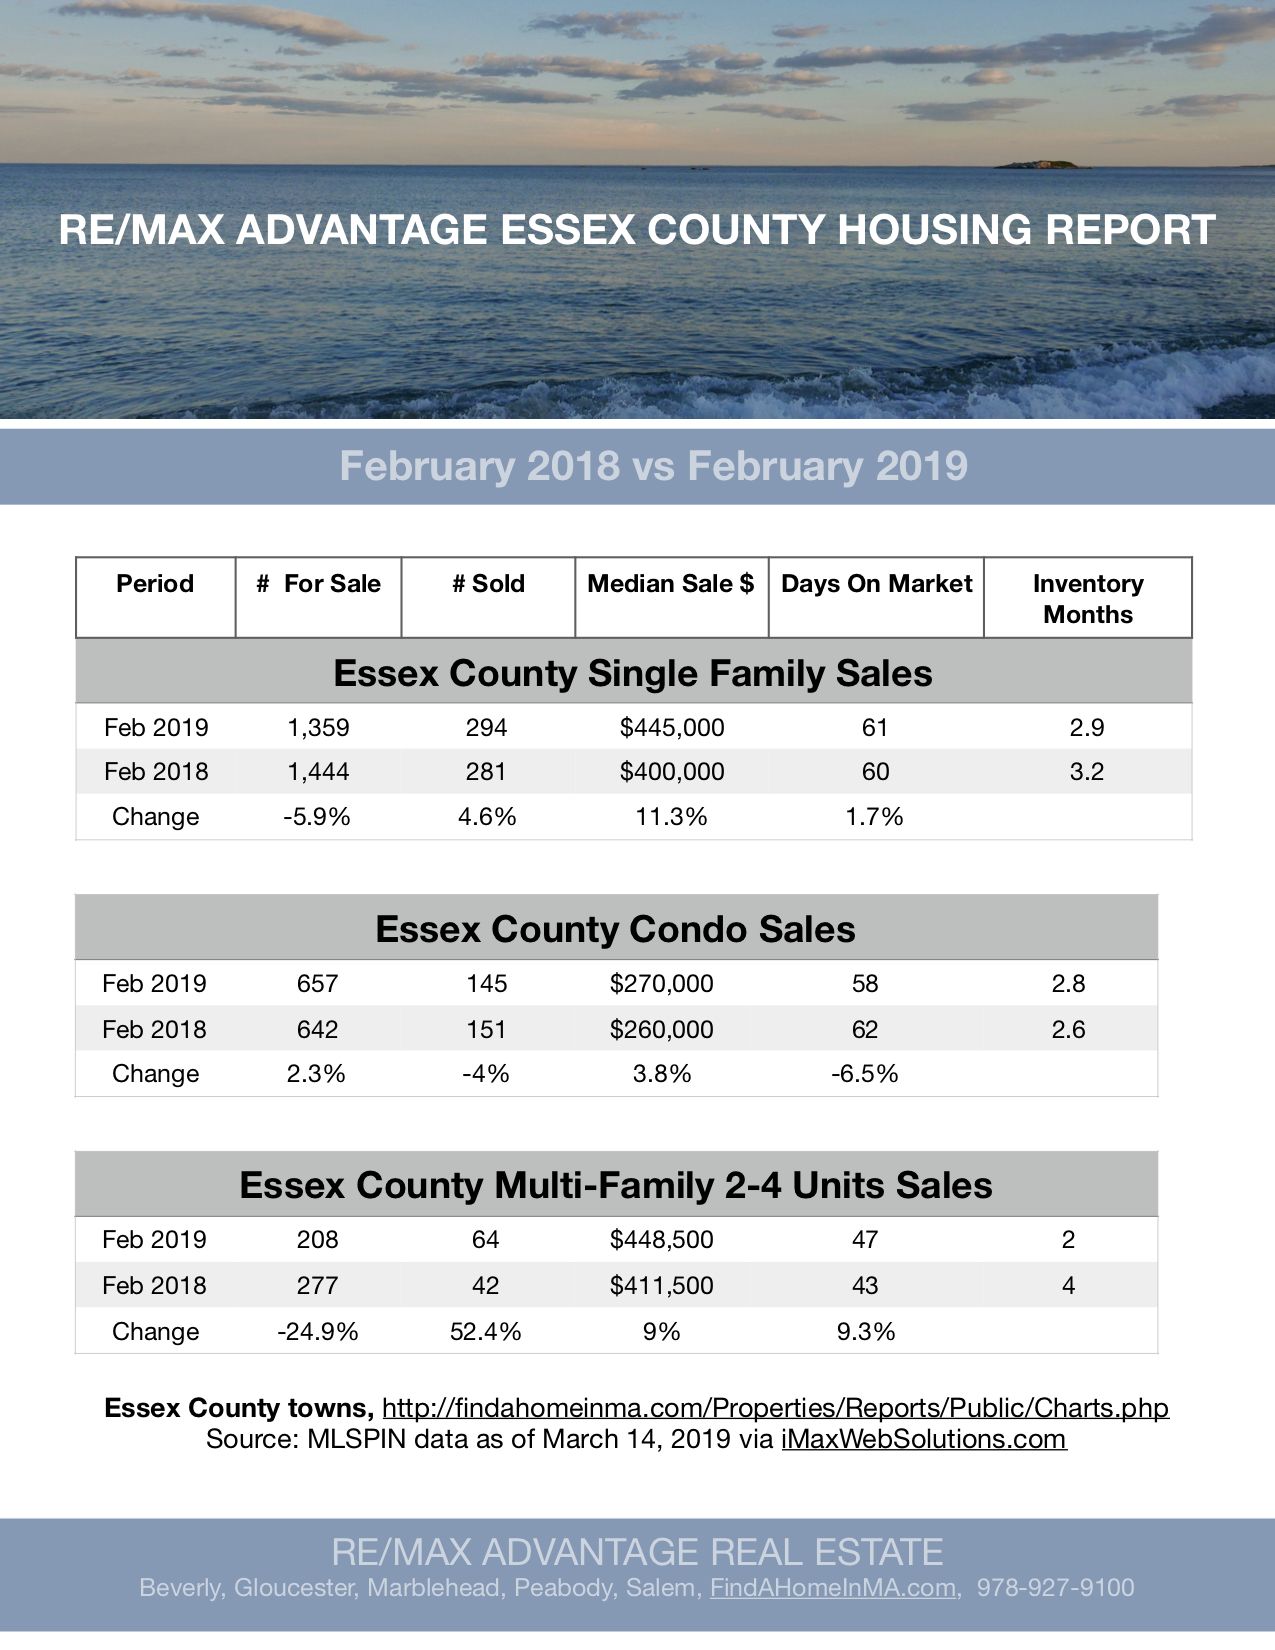

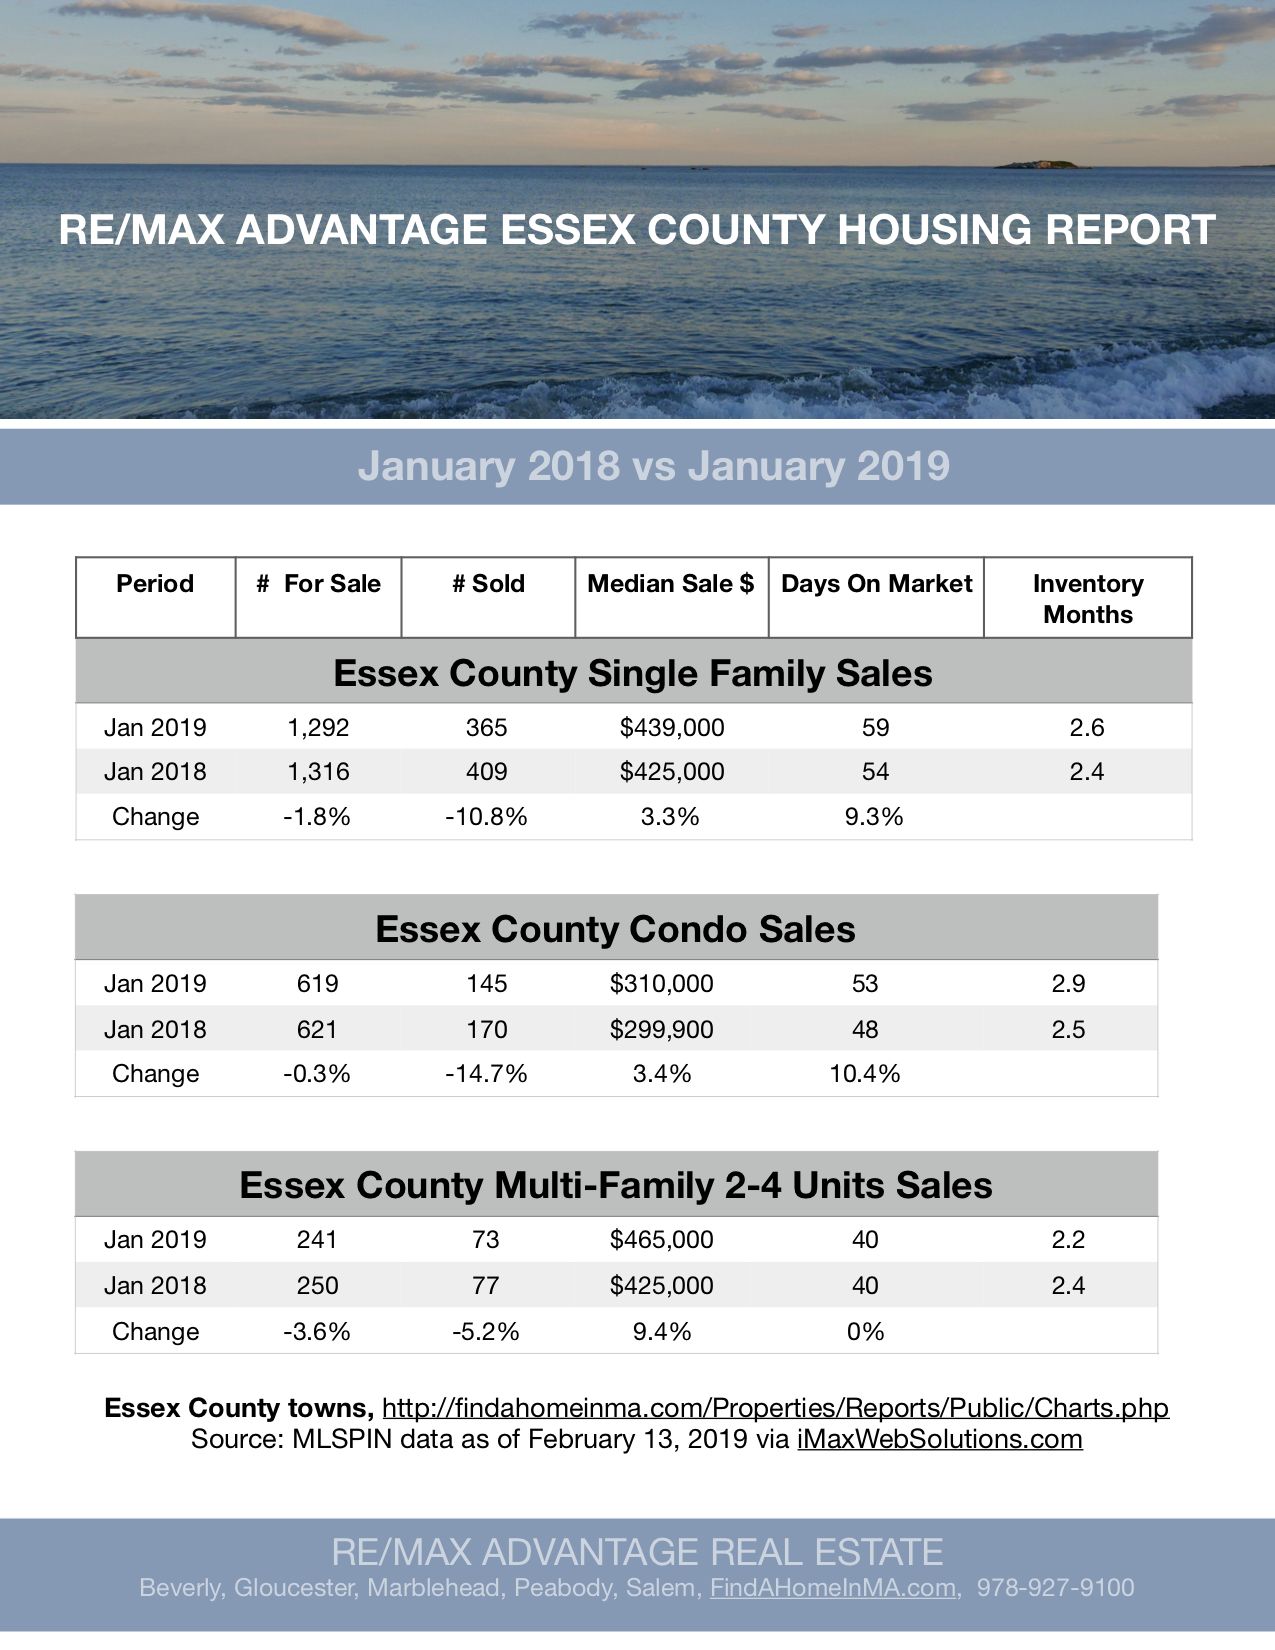
Essex County Housing Reports: January 2018 vs January 2019 Plus 3 Month and 6 Month Comparisons
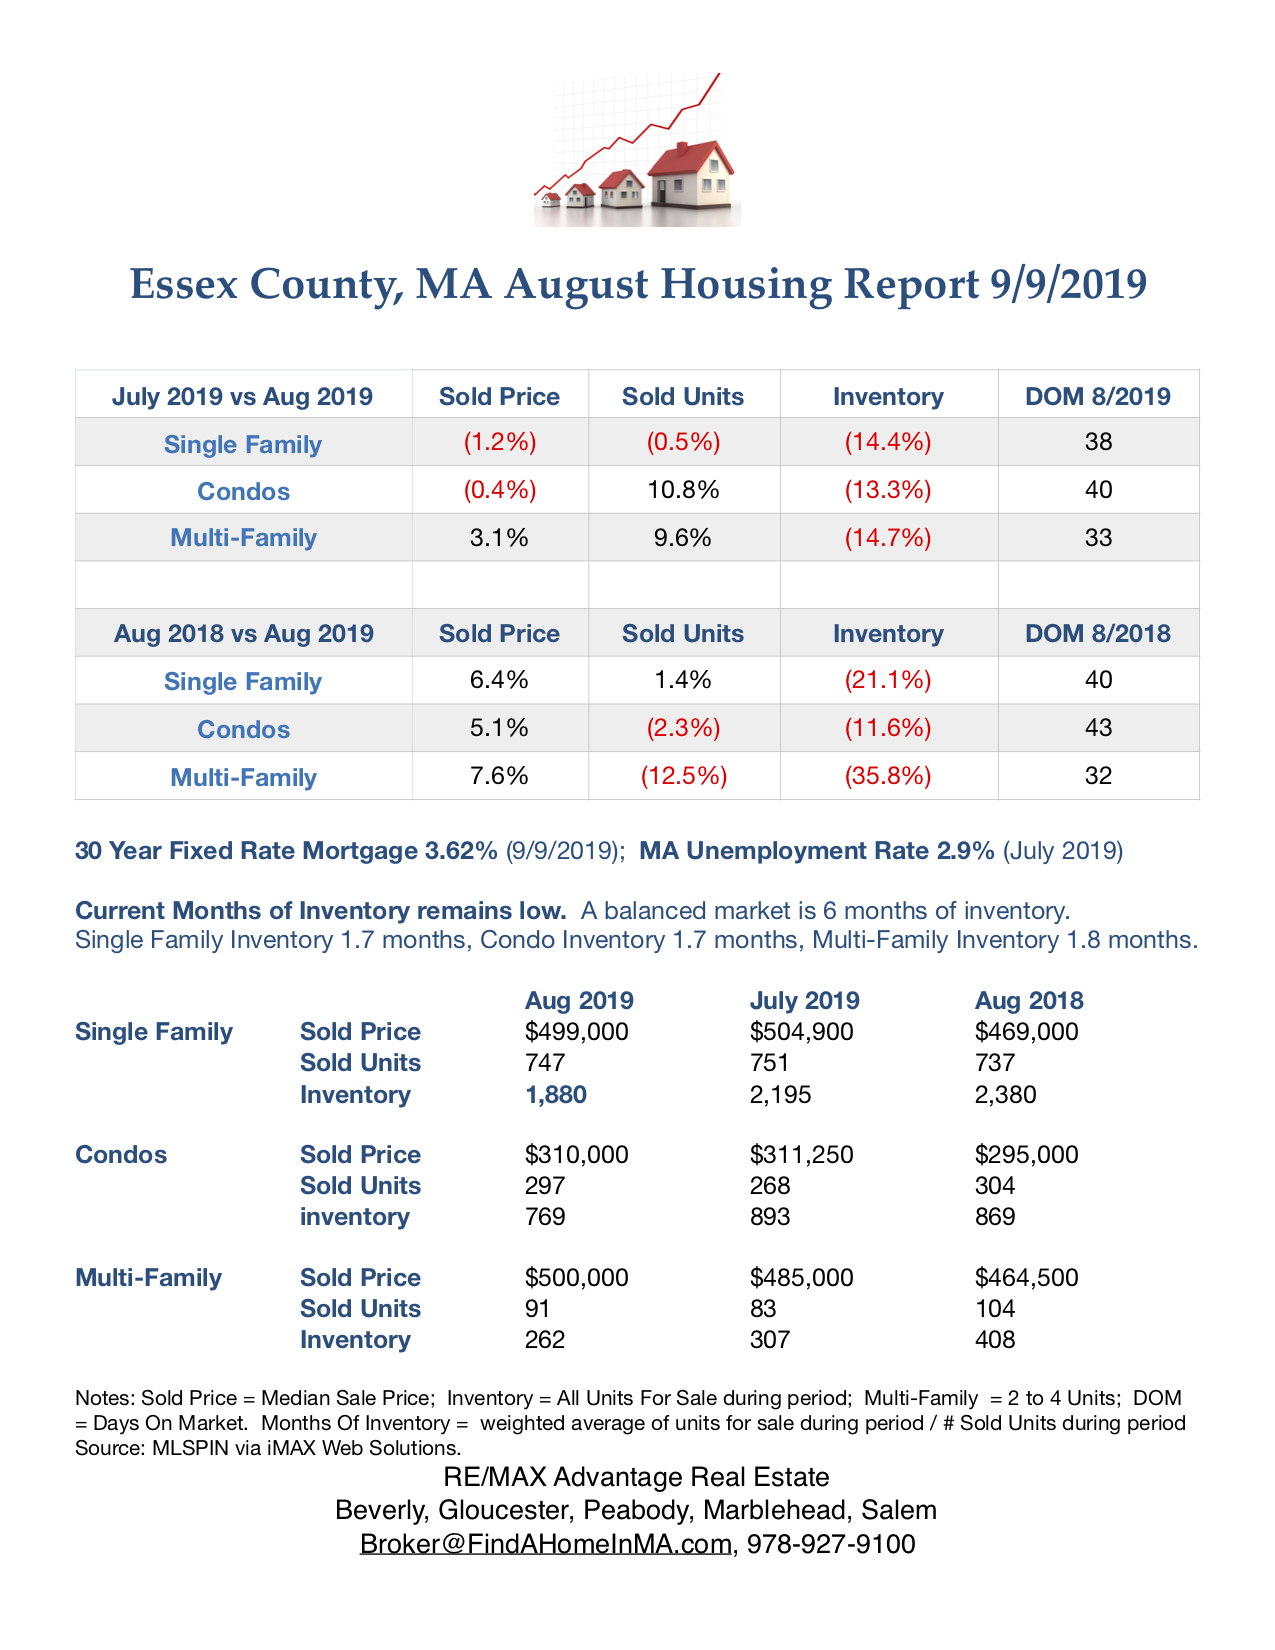
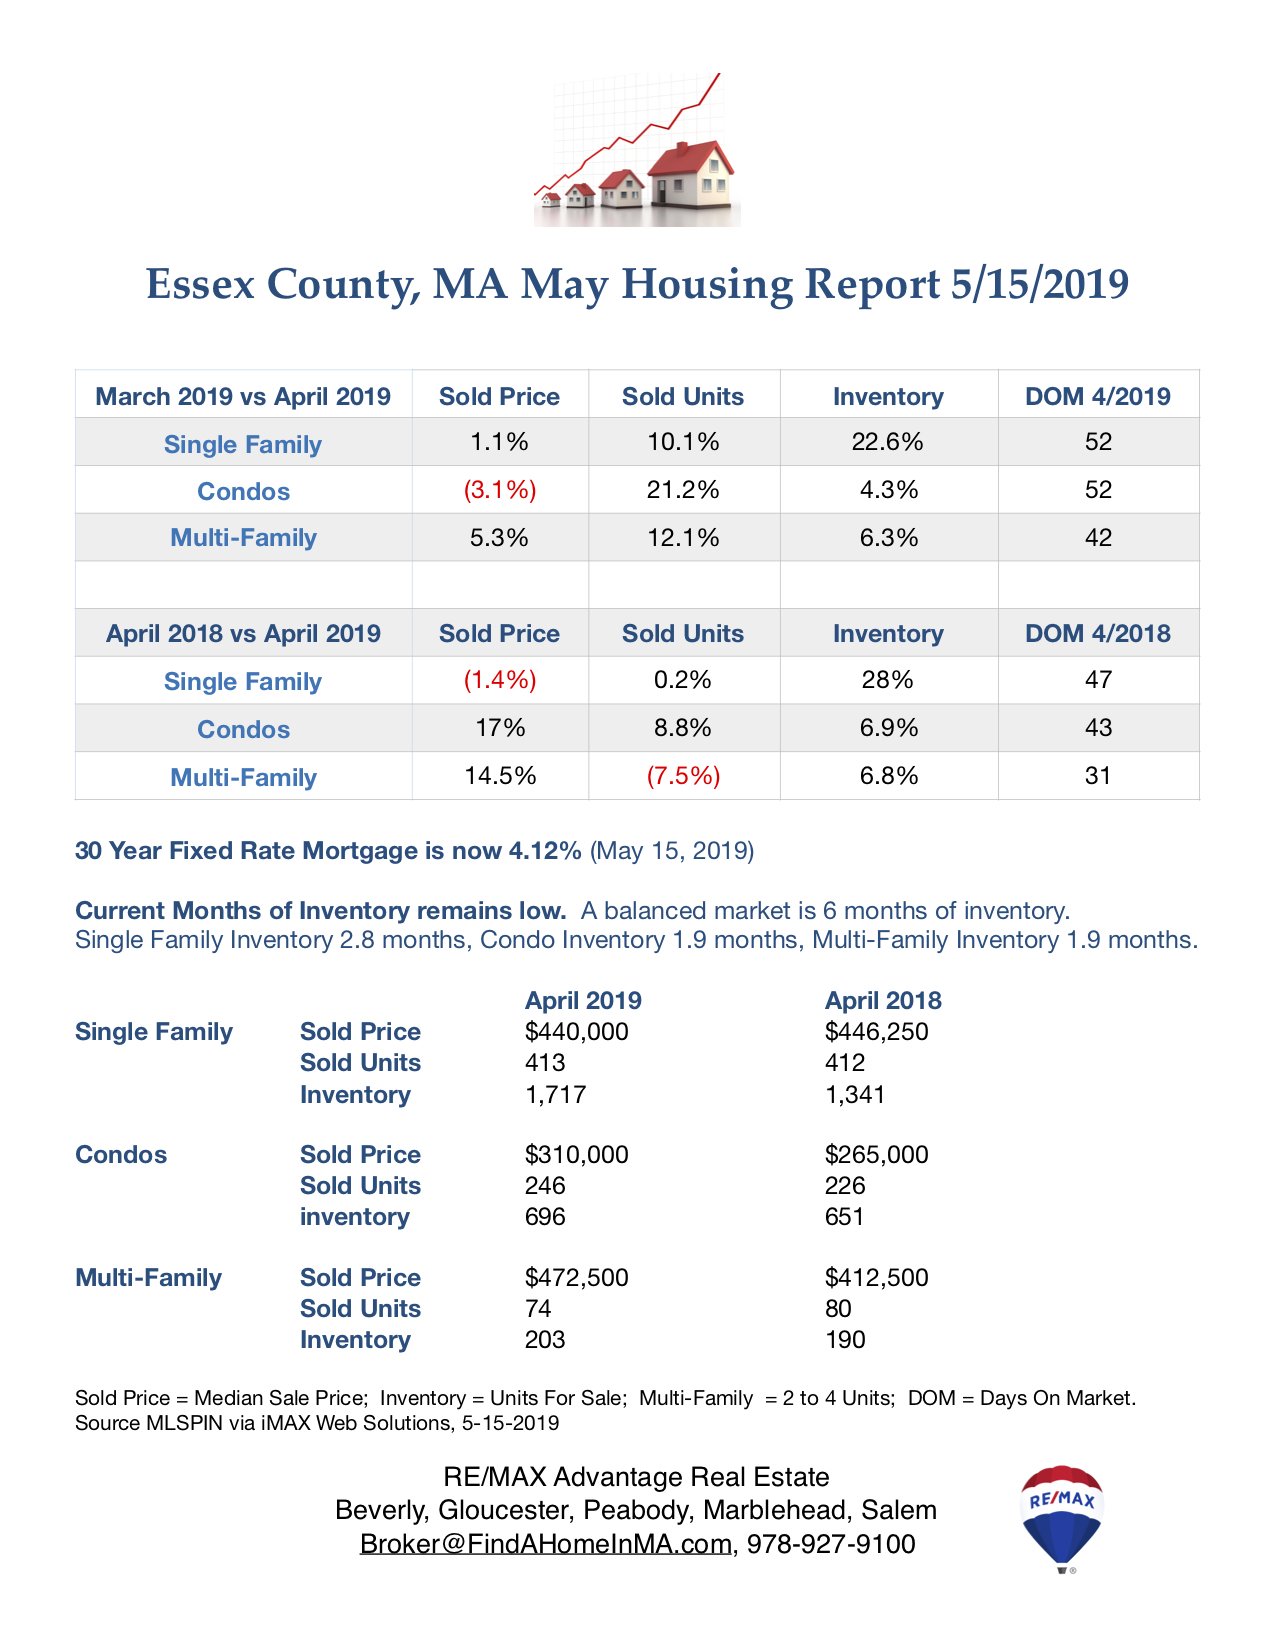
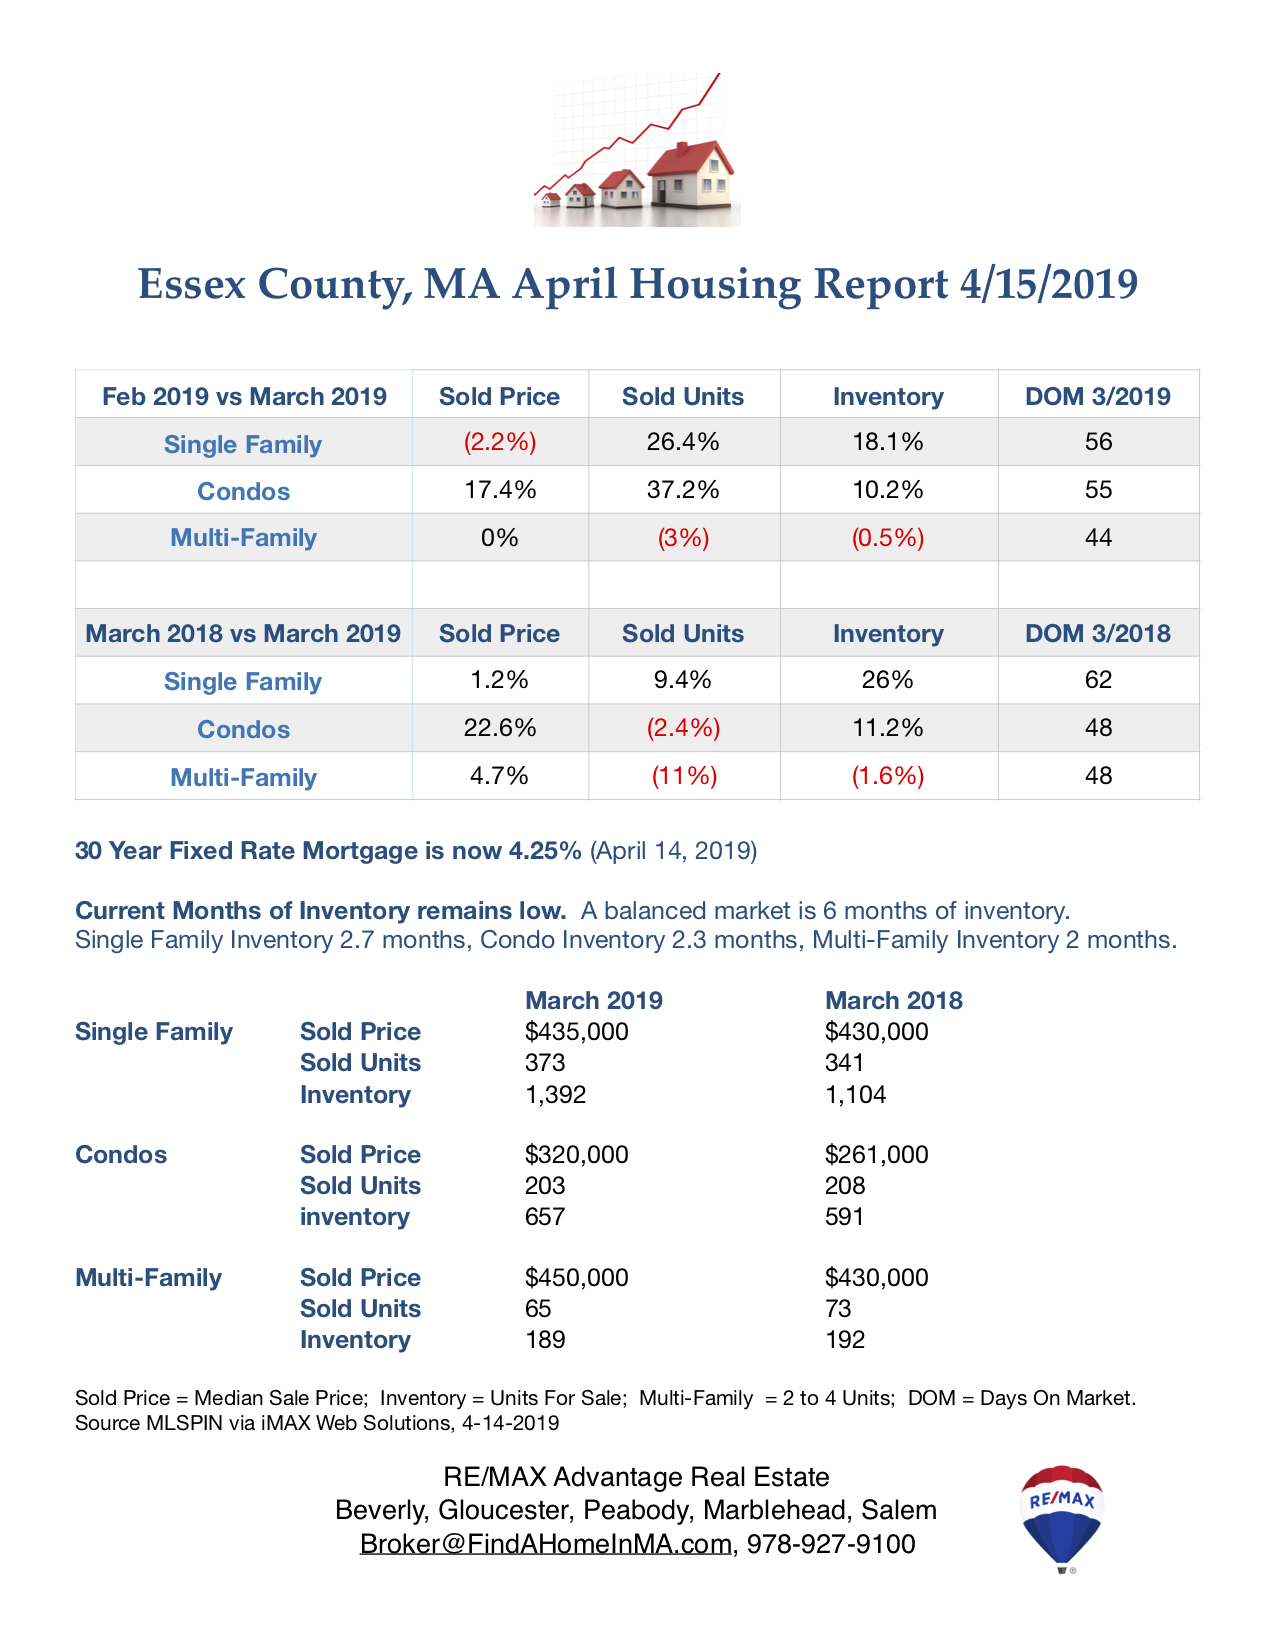
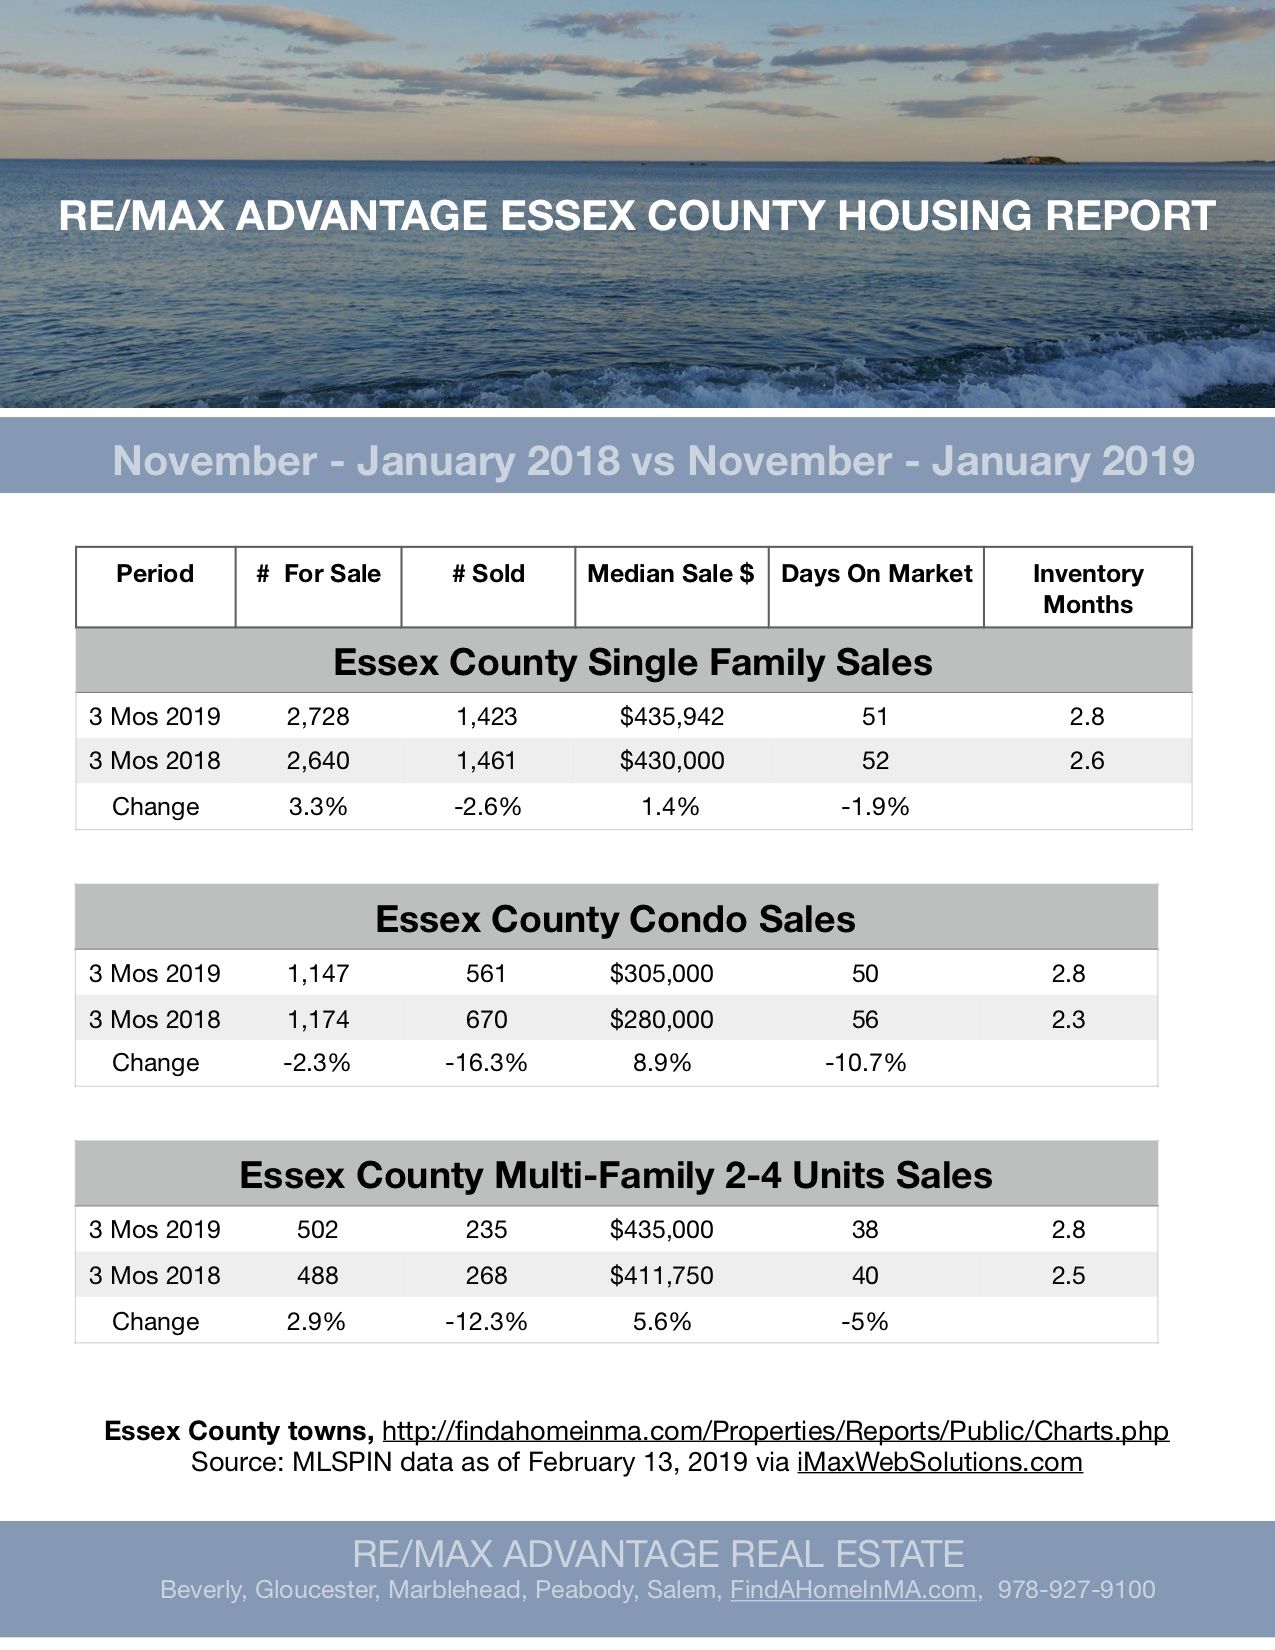
Inventories fell in January for all property types but turned positive for single family and multi-family over past 3 months.
Prices rose for all property types over all time frames.
Unit Sales contined to fall for all property types over all time frames
Here is breakdown by property type:
Single Family: January: Inventory Down 1.8% and Sale Prices Up 3.3%: 3 Months Inventory Up 3.3% and Sale Prices Up 1.4%
Condo: January Inventory Down 0.3% and Sale Prices Up 3.4%: 3 Months Inventory Down 2.3% and Sale Prices Up 8.9%
Muilti-Family: January Inventory Down 3.6% and Sale Prices Up 9.4%: 3 Months Inventory Up 2.9% and Sale Prices Up 5.6%
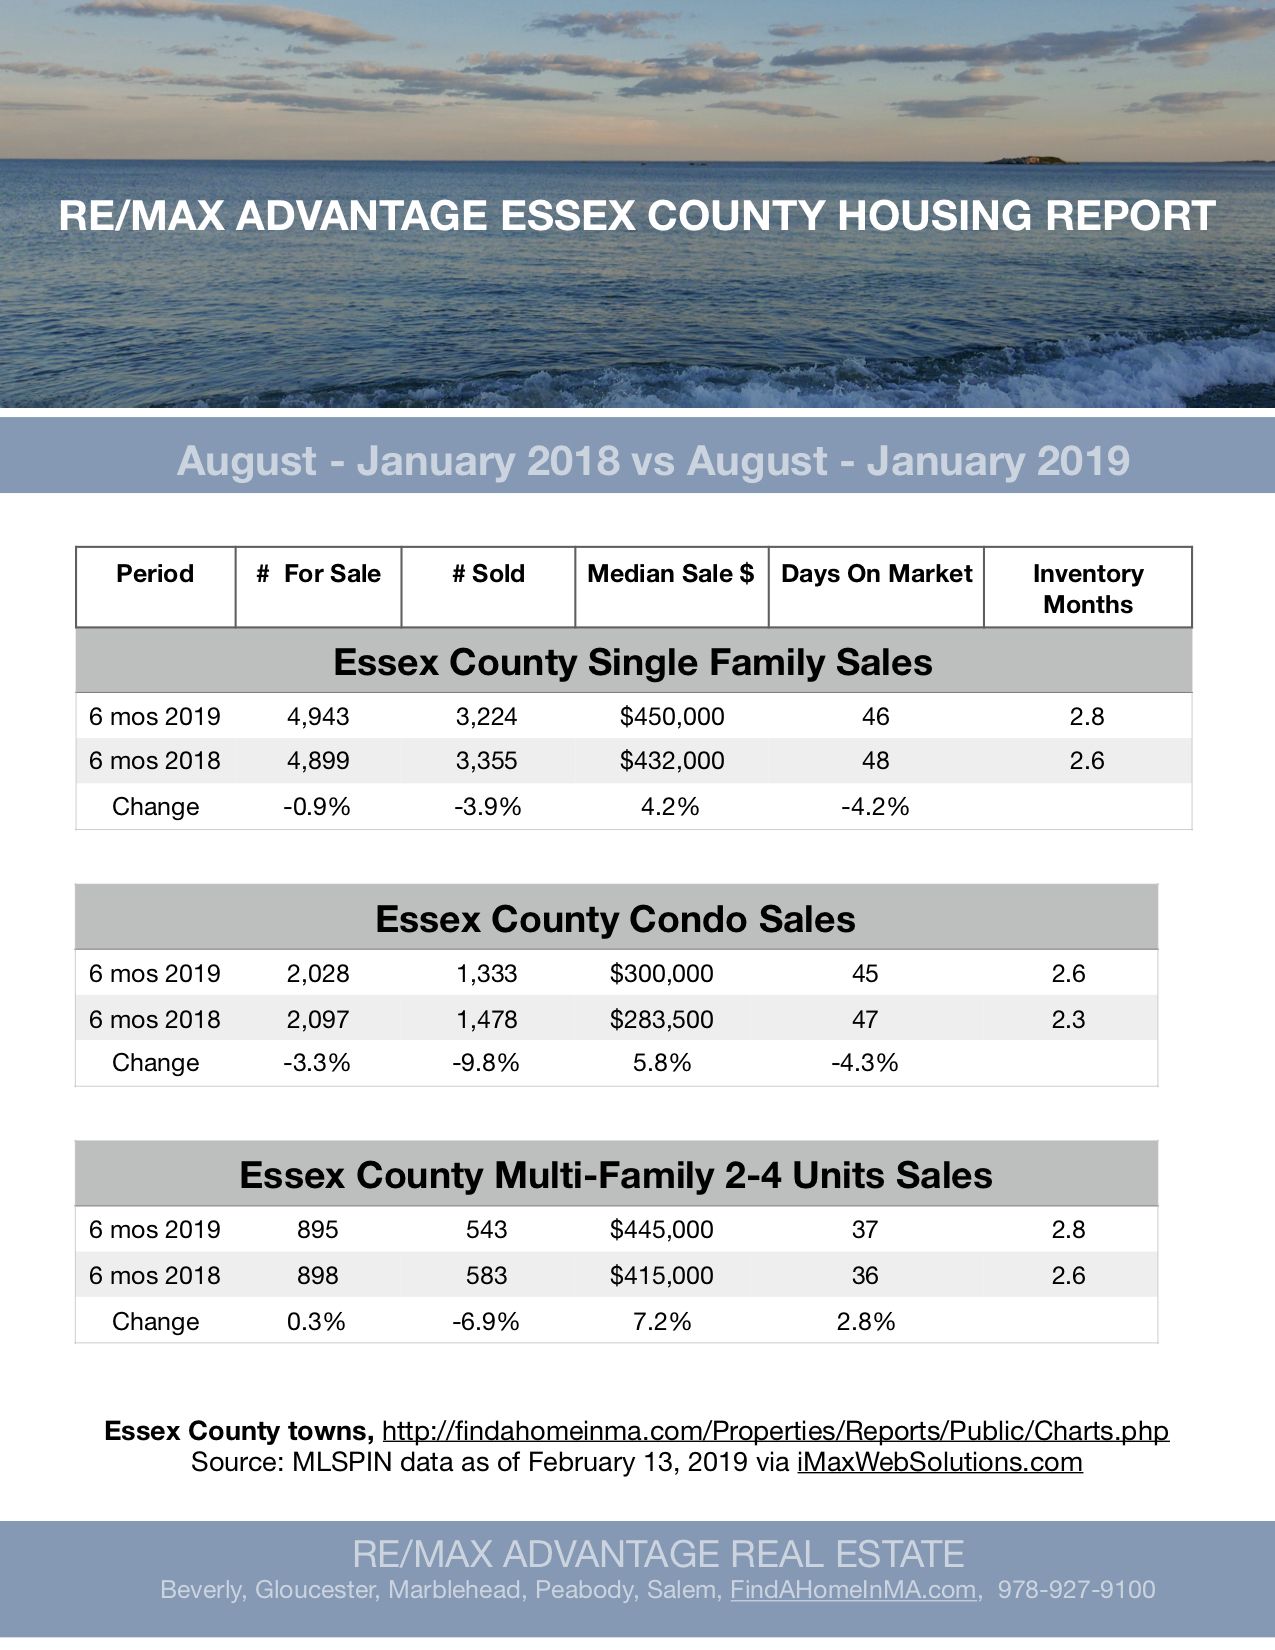
6 Months comparisons are also included.
To view data for every Essex County town, go to: http://www.sullivanteam.com/Properties/Reports/Public/Charts.php
To dowload the full Housing Report go to: http://sullivanteam.com/pages/EssexCountyHousingReports

http://blog.rismedia.com/?p=20761
Remodelers across the country took a hit last summer as the cost of building materials spiked dramatically, and the picture for 2019 isn't much rosier.
The percentage of return on investment (ROI) is projected to trend downward for all the replacement projects listed in Remodeling magazine's newly-released Cost vs. Value Report.
Related: 6 Costs Homeowners Overlook and How to Pay for Them
Larger indoor remodel projects took a hit as well, but weren't impacted as greatly as replacement projects as they rely more on labor costs rather than material costs.
"With the increasing costs of building materials and labor, we urge remodelers to think like real estate professionals first,” says Clayton DeKorne, editor-in-chief of Remodeling magazine. "When you adjust your focus to think like a broker first, you can dull clients’ No. 1 pain point—cost—with a discussion of the amount that can be recouped."
Nationally, here are the five projects with the greatest ROI in the report's mid-range cost category:
Manufactured Stone Veneer (94.9% ROI)
Minor Kitchen Remodel (80.5% ROI)
Deck Addition (Wood) (75.6% ROI)
Siding Replacement (75.6% ROI)
Entry Door Replacement (Steel) (74.9% ROI)
Nationally, Five projects with the greatest ROI in the report's upscale cost category are:
Garage Door Replacement (97.5% ROI)
Window Replacement (Vinyl) (73.4% ROI)
Grand Entrance (Fiberglass) (71.9% ROI)
Window Replacement (Wood) (70.8% ROI)
Bathroom Remodel (60.2% ROI)
Nationally—and on the other end of the spectrum—here are the five projects with the lowest ROI in the mid-range cost category:
Backyard Patio (55.2% ROI)
Master Suite Addition (59.4% ROI)
Bathroom Addition (60.6% ROI)
Roofing Replacement (Metal) (60.9% ROI)
Major Kitchen Remodel (62.1% ROI)
Nationally, Five projects with the lowest ROI in the upscale cost category are:
Master Suite Addition (50.4% ROI)
Bathroom Addition (58.1% ROI)
Major Kitchen Remodel (59.7% ROI)
Bathroom Remodel (60.2% ROI)
Window Replacement (Wood) (70.8% ROI)
The 2019 Cost vs. Value Report surveyed more than 3,200 real estate professionals about returns for 22 popular renovation projects in 136 different U.S. housing markets—up from 100 markets last year. View the full report, including project descriptions and city-level data, here.
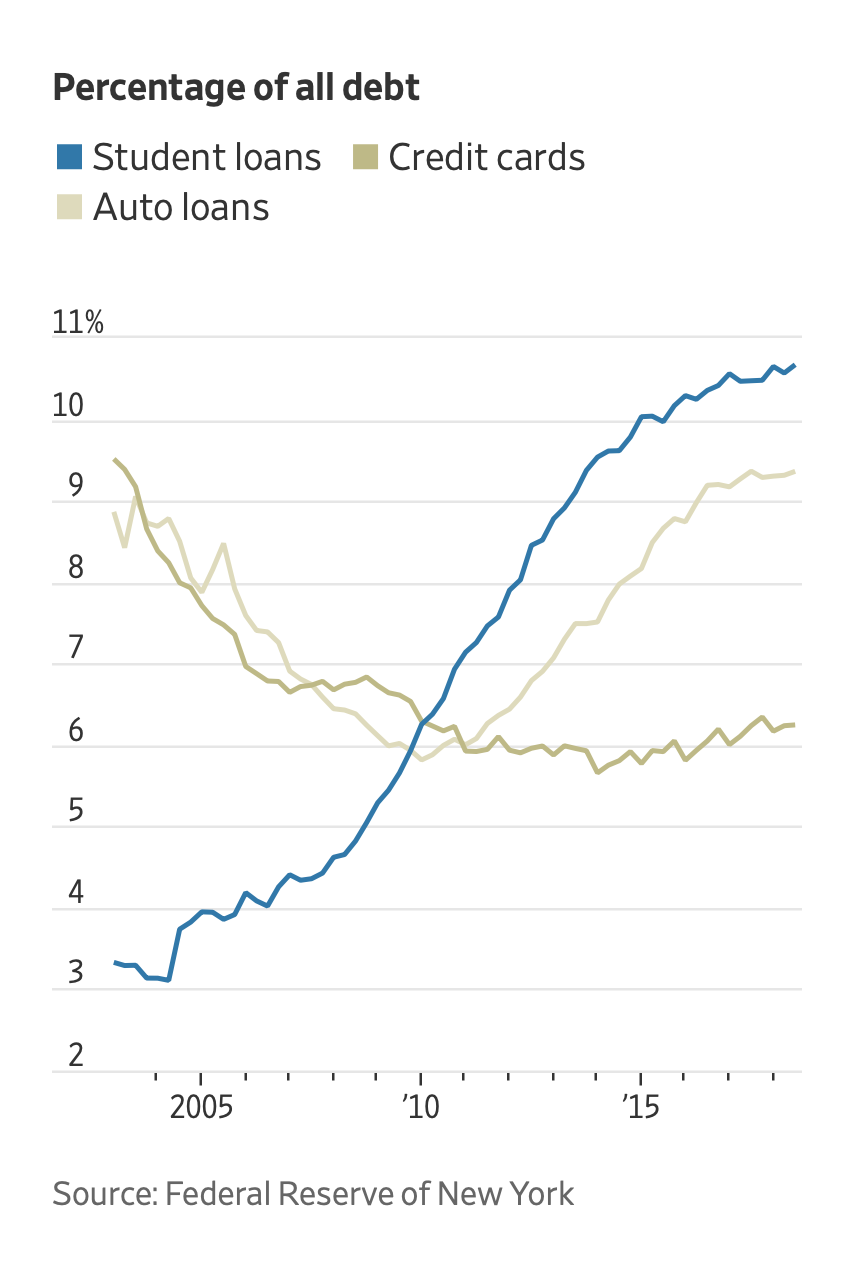
The effect of student debt on the economy has been debated in recent years, as the total has soared to $1.5 trillion, surpassing Americans’ credit-card and car-loan bills. Congress and various White House administrations have pointed to federal student loans as a key way for Americans to pay for college and boost their career earnings. Critics have said the debt is damaging the economic prospects of a generation of Americans.
The Fed research published Wednesday didn’t offer a verdict on those assertions. But it showed that student debt is linked to key life decisions for some—including whether to buy a home and where to live.
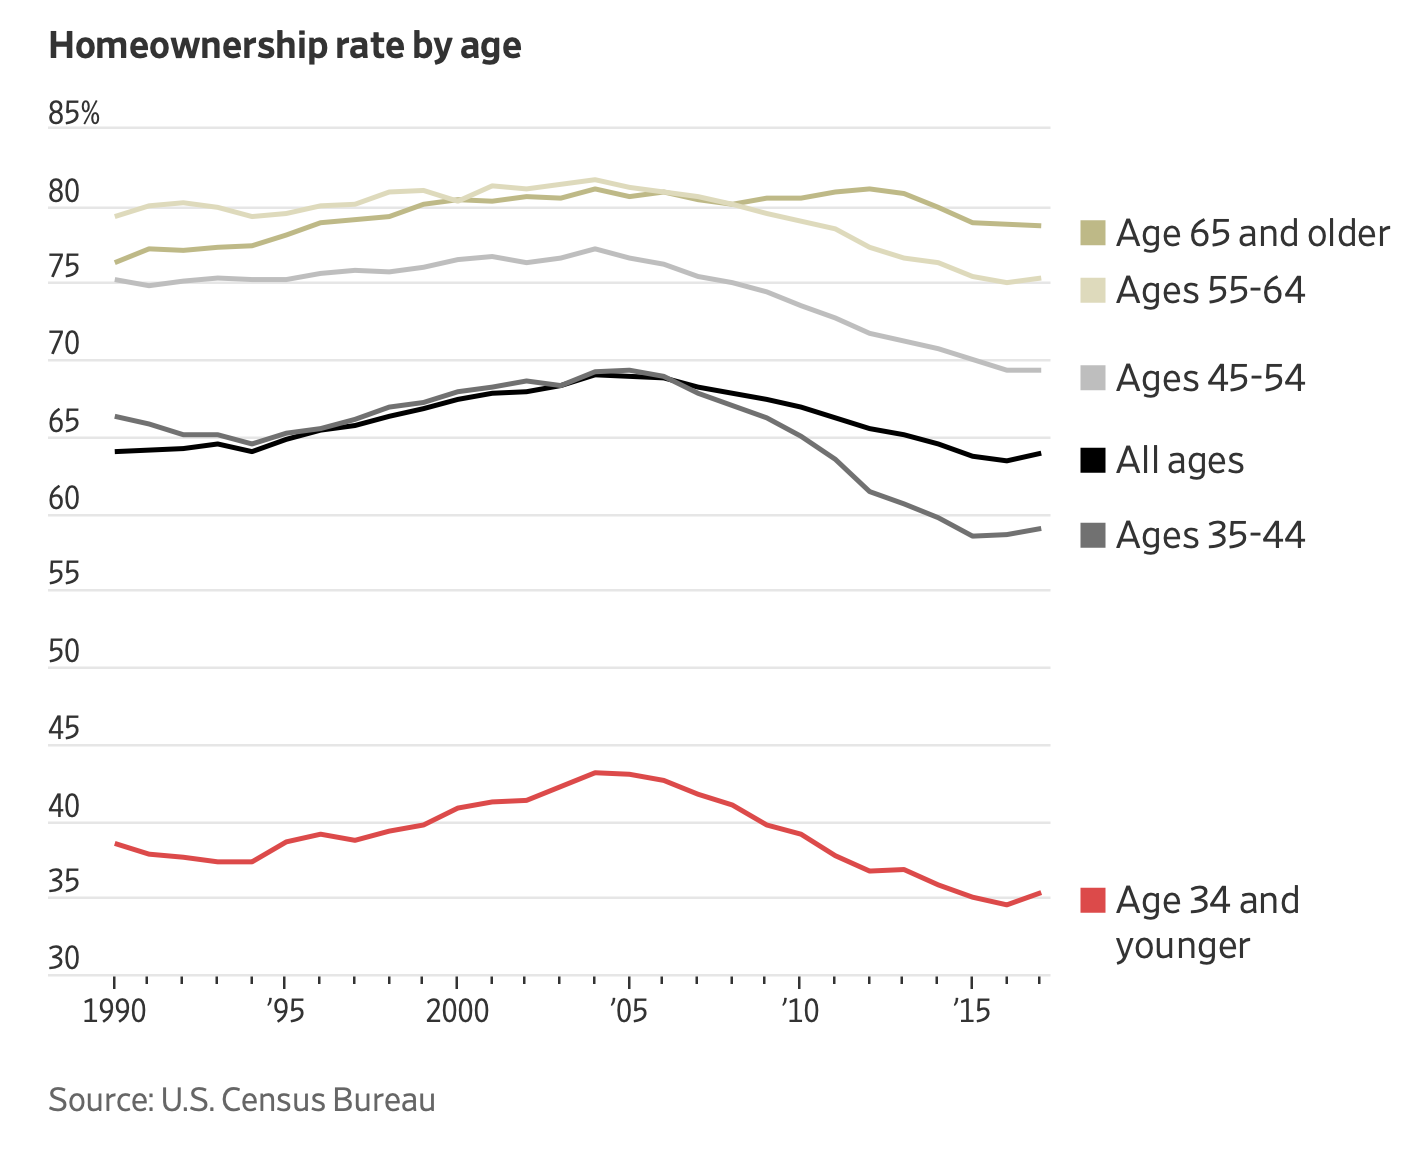
Homeownership among people ages 24 to 32 fell 9 percentage points, to 36% from 45%, between 2005 and 2014, the Fed said. While many factors affected the homeowner rate, the Fed said 2 percentage points, or about a fifth, of the decline was tied directly to student debt. That translated into 400,000 borrowers who could have owned a home by 2014 but didn’t because of student loans.
“While investing in postsecondary education continues to yield, on average, positive and substantial returns, burdensome student loan debt levels may be lessening these benefits,” the Fed researchers wrote.
The reports shed light on two of the economy’s biggest puzzles in recent years. The housing recovery has been historically weak and the fortunes of rural communitieshave lagged behind those of urban areas.
Research on the effect of student debt on homeownership has been mixed. Some economists have found that even with the burden of debt, the wage boost from getting a college degree still makes it easier for many borrowers to buy homes.
“Basically the only way to get your foot in the housing door is to have a degree, even if it comes with debt,” said Ralph McLaughlin, deputy chief economist atCoreLogic Inc.
College graduates are far more likely to be employed and earn more than workers with only a high-school diploma. The typical American between ages 22 and 27 with a bachelor’s degree earned $42,000 in 2017, according to the New York Federal Reserve. The typical worker with just a high-school diploma earned $28,000.
Skylar Olsen, director of economic research and outreach at Zillow, said student loans are combining with high rents and rising home prices to make it difficult for younger households to save for down payments. “It’s a one-two punch,” she said.
Over the past couple of years, lenders have been making a larger share of loans to borrowers who spend more than 45% of their monthly pretax income on their mortgage payment and other debt, including student loans. The mortgage industry is experimenting with various initiatives to address concerns that student loans make it difficult for millennials to purchase their first homes.
The new Fed paper studied borrowers during a period—2005 to 2014—when delinquencies on student loans soared. Since then, many borrowers have enrolled in plans that reduce their monthly bills by setting payments as a share of their incomes. These income-driven repayment plans have been linked to a decline in delinquencies. The Fed research doesn’t address whether this development has diminished the effects of student debt on homeownership, which has picked up among young Americans in the past year.
Write to Josh Mitchell at joshua.mitchell@wsj.com and Laura Kusisto at laura.kusisto@wsj.com

|
||||||

