Thumbnail Slider

The New Normal: A Strong Housing Market Expected to Continue into 2021


The New Normal: A Strong Housing Market Expected to Continue into 2021

 “2020 will be known for a lot of things, and a record-breaking year for real estate will certainly be one of its more unexpected legacies,” prominent economist Daryl Fairweather said.1 And he’s right: most of us would have expected the housing market to suffer from circumstances like a once-in-a-hundred-years pandemic and historic inventory shortages. 

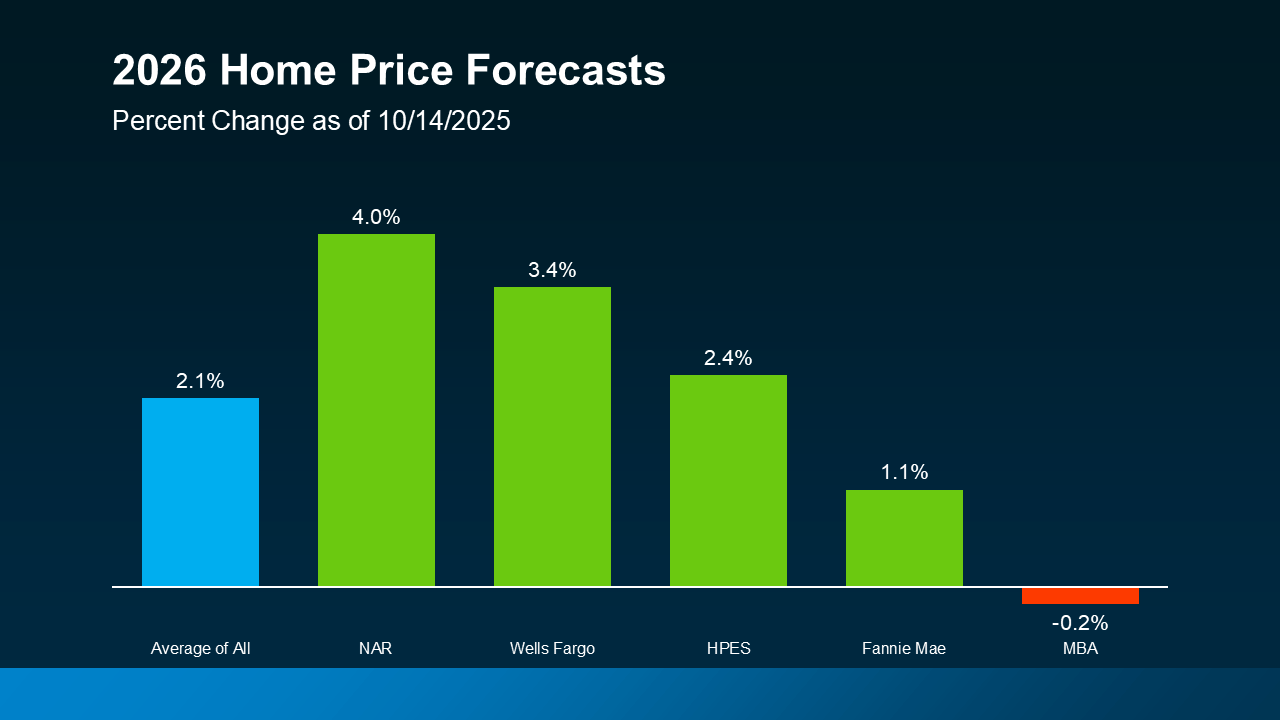
But, rather than a slowdown, we are continuing to experience a surprisingly robust real estate market across the country. And experts estimate that these conditions are likely to last well into the new year. Fannie Mae Senior VP and Chief Economist Doug Duncan predicts that existing home sales will ultimately “be up a percent or more in 2021.” He believes home prices will continue to rise due to limited inventory, but he is confident the Federal Reserve will keep interest rates low into the future, which will be “very good for households.”2

Market conditions like fewer available listings, changing criteria for desired homes, and record-low mortgage rates are changing the way people buy and sell homes, most likely in a lasting way. But this sustained activity, even in the uncertainty that is 2020, proves that our country still views real estate as a sound investment. The only question now is how you can take advantage of the housing market’s “new normal.” 

FEWER LISTINGS EQUALS A SELLER’S MARKET

Inventory, meaning the number of homes for sale, is at a record low across the country. The National Association of Realtors (NAR) reports there are fewer homes on the market today than the association has seen in data going all the way back to 1982.Currently, the total housing inventory is about 1.47 million units, which is a decline of 19.2% from one year ago.4

Experts do predict some relief on the horizon. MarketWatch had previously anticipated housing starts would occur at a pace of 1.45 million and building permits would come in at a pace of 1.52 million.But it turns out that the market exceeded expectations: compared with last year, housing starts are up 11% and permitting for new homes occurred at a seasonally-adjusted annual rate of 1.55 million. That represents a 5% increase from August and an 8% increase from a year ago.

For now, the fact that there are fewer listings creates an advantageous housing market for sellers. There are several reasons why. 

For one, buyers have to act fast to snap up available homes. As a result, most properties that come on the market stay for an average of just 21 days before they are sold.6 “That is the fastest ever recorded in our monthly series,” says NAR Chief Economist Lawrence Yun.

Another benefit is that sellers are enjoying higher net returns on their listings. This is thanks to the tough competition for homes, which often results in bidding wars between buyers. Nationwide, the median home price in September rose to $311,800. That translates to about $40,000 (15%) more than just a year ago.7

This seller’s market is not simply a product of the pandemic. In fact, in the country’s top 100 metro markets, inventory has been dwindling since the first quarter of 2020.8 This means that even with increased construction, buyers can’t simply wait for things to go back to normal before reentering the market. Rather, all signs indicate that this is the new normal.

What It Means for Homeowners: 

These higher home prices show that buyers are willing to spend more on a home right now than they did last year. So, if there ever were a time to list for top dollar—and expect to receive asking price quickly—that time is now. Ask us for a free consultation of your home’s value today.

What It Means for Homebuyers:

Due to low inventory, buyers could easily find themselves in a bidding war. Time is of the essence in a seller’s market, so you’ll need to get your financing in order and be preapproved for a loan before you begin your home search. We can connect you with a trusted mortgage professional to get you started.

BUYERS BENEFIT FROM LOW MORTGAGE RATES AND A BIGGER PLAYING FIELD

Don’t worry, homebuyers. This “new normal” of real estate has benefits for you too.  

For example, people used to base their next home purchase on how far the commute was to work or in which public school district it was. But now, thanks to the pandemic shifting the locus of jobs and work, they are free to consider what they need from a home to make it a place they truly want to be in as they work, teach, exercise, cook, and live. 

Often, this equates to needing more space in different types of areas. Realtor.com consumer surveys show that people are desiring quieter neighborhoods, home offices, updated kitchens, and access to the great outdoors.9 The search for these criteria is driving residents out of densely populated metropolitan areas and into the suburbs.10 And this exodus from cities is good news for buyers: it opens up more possibilities for inventory that they could not have considered pre-pandemic. 

Another advantage for buyers is the record-low mortgage rates. The average rate for a 30-year fixed-rate mortgage hit a record low in mid-October when rates fell to 2.81%. That’s the lowest since Freddie Mac began conducting the survey in 1971, and well below last year’s 3.69%.11 Similarly, a 15-year fixed-rate mortgage can be had for as low as 2.35% compared to 3.15% a year ago.

Thanks to these rates, buyers are afforded the opportunity to buy nearly $32,000 more home than they could one year ago, while keeping their monthly payment the same.12 So even though home prices are high now, it is currently more affordable to buy a home now than it was last year.

If you want to take advantage of these rock-bottom mortgage rates, you need to act fast. Though rates are projected to stay low, housing economists predict that the window of opportunity to get the best rate could be closing in the coming months. Mike Fratantoni, chief economist at the Mortgage Bankers Association, said he expects the average rate on a 30-year mortgage to rise to 3.5% by the end of 2021.13

What It Means for Homeowners:

Record-low mortgage rates offer you the opportunity to lower your monthly payment—or even take out some equity—with a refinance. With those additional funds, you could even choose to invest in a second home in a new desirable location. Reach out to us for a referral to a trusted mortgage professional or an agent in those markets. 

What It Means for Homebuyers:

The time is now to determine how much home you can comfortably afford and make a plan to find it. We can set up a search for you to find homes that best meet your new needs, even if they’re in neighborhoods you wouldn’t have considered before. 

A RECORD-SETTING YEAR FOR HOME SALES IS JUST THE BEGINNING

Despite the seemingly adverse buyer conditions, 2020 experienced a 14-year high number of home sales, NAR reports. Existing-home sales, which include single-family homes, townhomes, condominiums and co-ops, rose 9.4% in September to a seasonally adjusted annual rate of 6.54 million.14 That’s a 21% increase from a year ago! 

Every region of the country has seen a surge in sales activity. According to George Ratiu, senior economist for Realtor.com, part of the reason for these continued sales is that the pandemic has created a paradigm shift in the patterns of real estate.15 For example, housing needs are typically resolved by late summer and early fall to coincide with the commencement of the new school year. With homeschooling and remote work, however, buyers have been freed to continue their home search into the traditionally slow winter months.

Another reason for the robust market is that Millennials are finally putting their money into homeownership. According to the U.S. Census Bureau, the homeownership rate for 25-to-34-year-olds rose to 40.7% by the end of last year.16 This is significant because Millennials, the generation of people in their mid-20s to late-30s, currently surpasses Baby Boomers as the nation’s largest living adult generation. As the remaining percentage of this group starts investing in homes in the near future, demand will persist.

All of these factors indicate that the housing market is poised to remain strong as we head into the new year. And as Jonathan Woloshin, head of U.S. real estate at UBS Global Wealth Management, believes, they could “buoy the housing market for years to come.”17 

What It Means for Homeowners:

It’s tempting to believe that homes will basically sell themselves in a market like this. But we’re still seeing properties that are overpriced and under-marketed sit unsold. We can help you optimize the process of selling your home so you can get the best possible offer.

What It Means for Homebuyers:

Preparation is key to success in a seller’s market like this, but don’t let yourself become paralyzed. We are here to answer your questions and offer sound advice to guide you through all the options that are available to you.

REAL ESTATE IS A SAFE BET

Your other investments might have been on roller coasters this year, but the real estate market has been steady, competitive, and strong throughout. That makes it a good choice for your financial future.

National real estate numbers can give us a pulse on the market, but real estate happens in our own backyard. As your local market experts, we can help you understand the finer points of the market that impact sales and home values in your own neighborhood. 

If you’re considering buying or selling a home before the new year or in early 2021, contact us now to schedule a free consultation. We’ll work with you to develop an actionable plan to meet your goals.

Sources:

  1. Redfin -
    https://www.redfin.com/news/housing-market-news-september-2020/

  2. Housing Wire - 

https://www.housingwire.com/articles/fannie-maes-doug-duncan-offers-his-predictions-for-2021/

  1. CNBC – 

https://www.cnbc.com/2020/10/22/september-existing-home-sales-jump-9point5percent.html

  1. NAHB – 

http://eyeonhousing.org/2020/10/existing-home-sales-surge-despite-record-low-supply

  1. MarketWatch – 

https://www.marketwatch.com/story/new-home-construction-slows-slightly-in-august-driven-by-pullback-in-multifamily-starts-2020-09-17

  1. National Association of Realtors – 

https://www.nar.realtor/newsroom/existing-home-sales-soar-9-4-to-6-5-million-in-september

  1. Business Insider - https://www.businessinsider.com/how-2020-broke-the-housing-market-inventory-could-run-out-2020-9

  2. Forbes -

https://www.forbes.com/sites/petertaylor/2020/10/11/covid-19-has-changed-the-housing-market-forever-heres-where-americans-are-moving-and-why/#74e7355761fe

  1. Realtor.com – 

    https://www.realtor.com/research/top-consumer-home-features-coronavirus/

  2. Wealth Advisor – https://www.thewealthadvisor.com/article/covid-19-has-changed-housing-market-forever-heres-where-americans-are-moving-and-why

  3. Washington Post -

https://www.washingtonpost.com/business/2020/10/15/30-year-mortgage-rate-drops-record-low/

  1. Forbes – 

https://www.forbes.com/advisor/mortgages/buying-a-home-low-mortgage-rates/

  1. BankRate - 

https://www.bankrate.com/mortgages/refinance-window-could-close-soon/

  1. National Association of Realtors – 

https://www.nar.realtor/newsroom/existing-home-sales-soar-9-4-to-6-5-million-in-september

  1. Forbes -

https://www.forbes.com/sites/petertaylor/2020/10/11/covid-19-has-changed-the-housing-market-forever-heres-where-americans-are-moving-and-why/#74e7355761fe

  1. TD Economics – 

https://economics.td.com/us-falling-mortgage#:~:text=The%20homeownership%20rate%20among%20millennials,47.7%25%20at%20a%20comparable%20age.&text=This%20means%20that%201.4%20million,that%20of%20the%20older%20generation

  1. Axios Media -

https://www.axios.com/real-estate-market-819e3c85-3765-4014-91c0-b545be6d5935.html

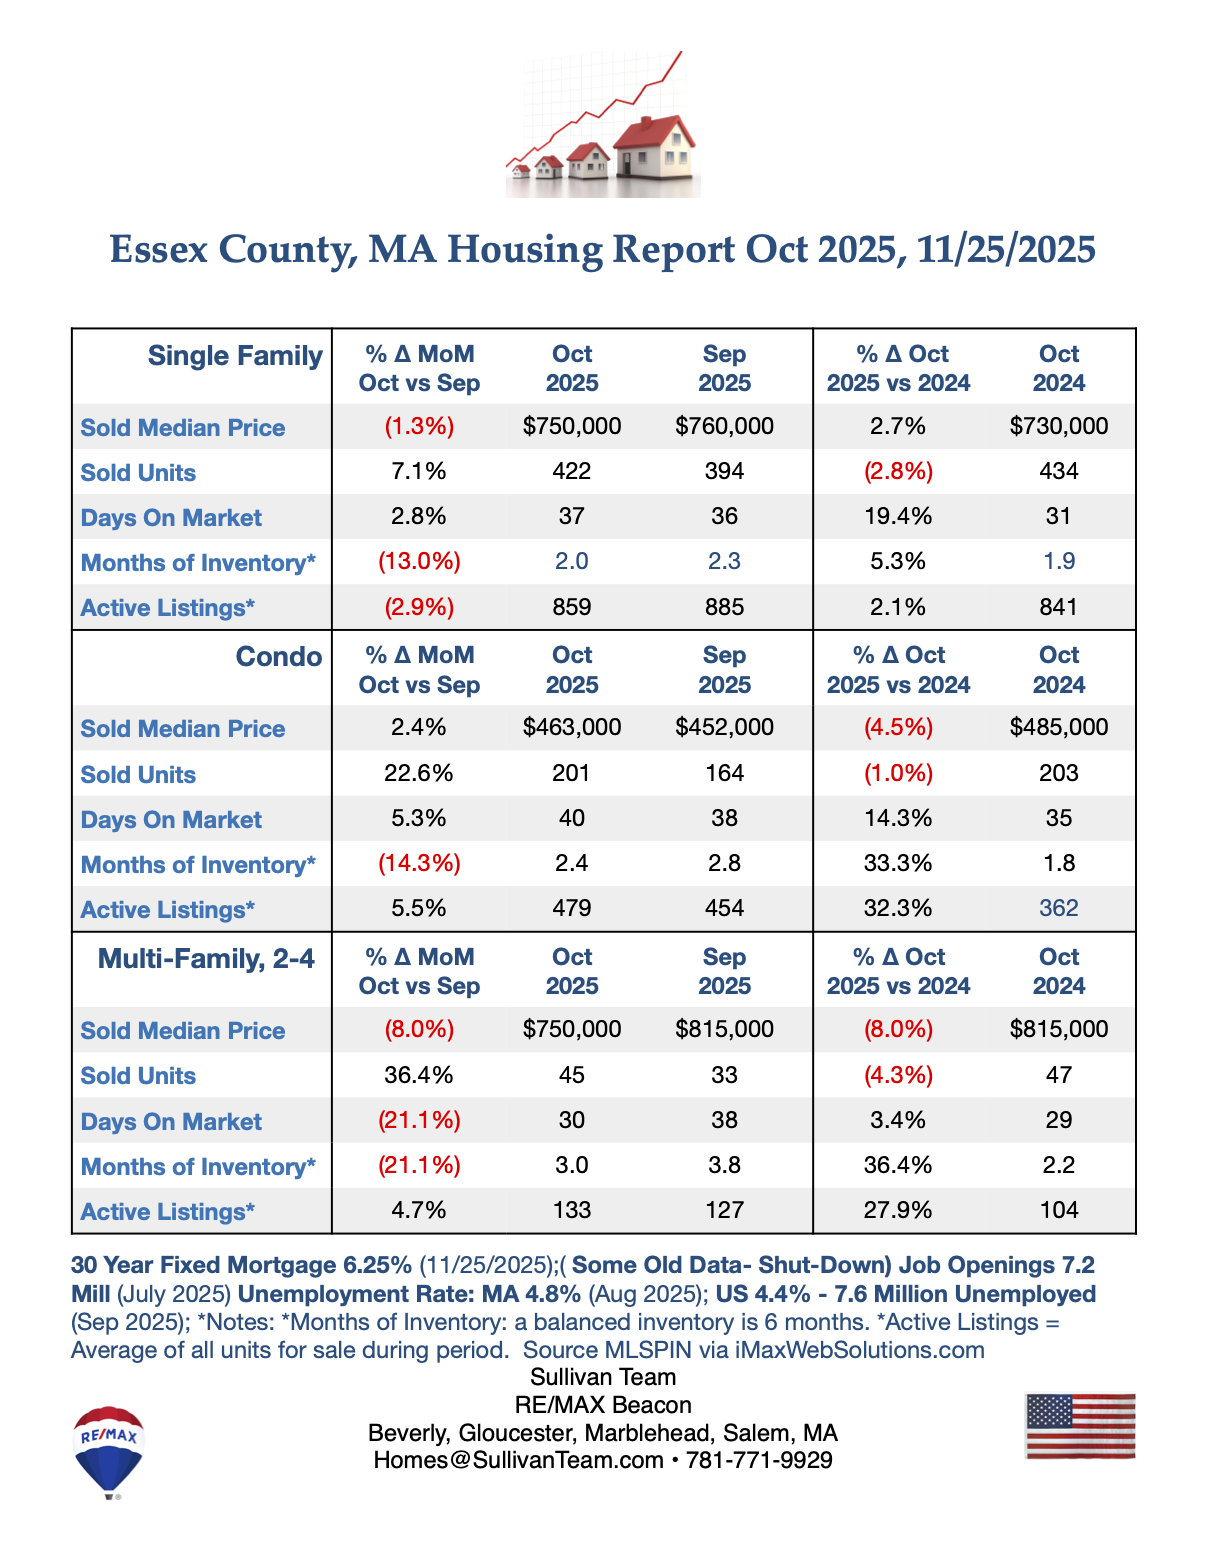
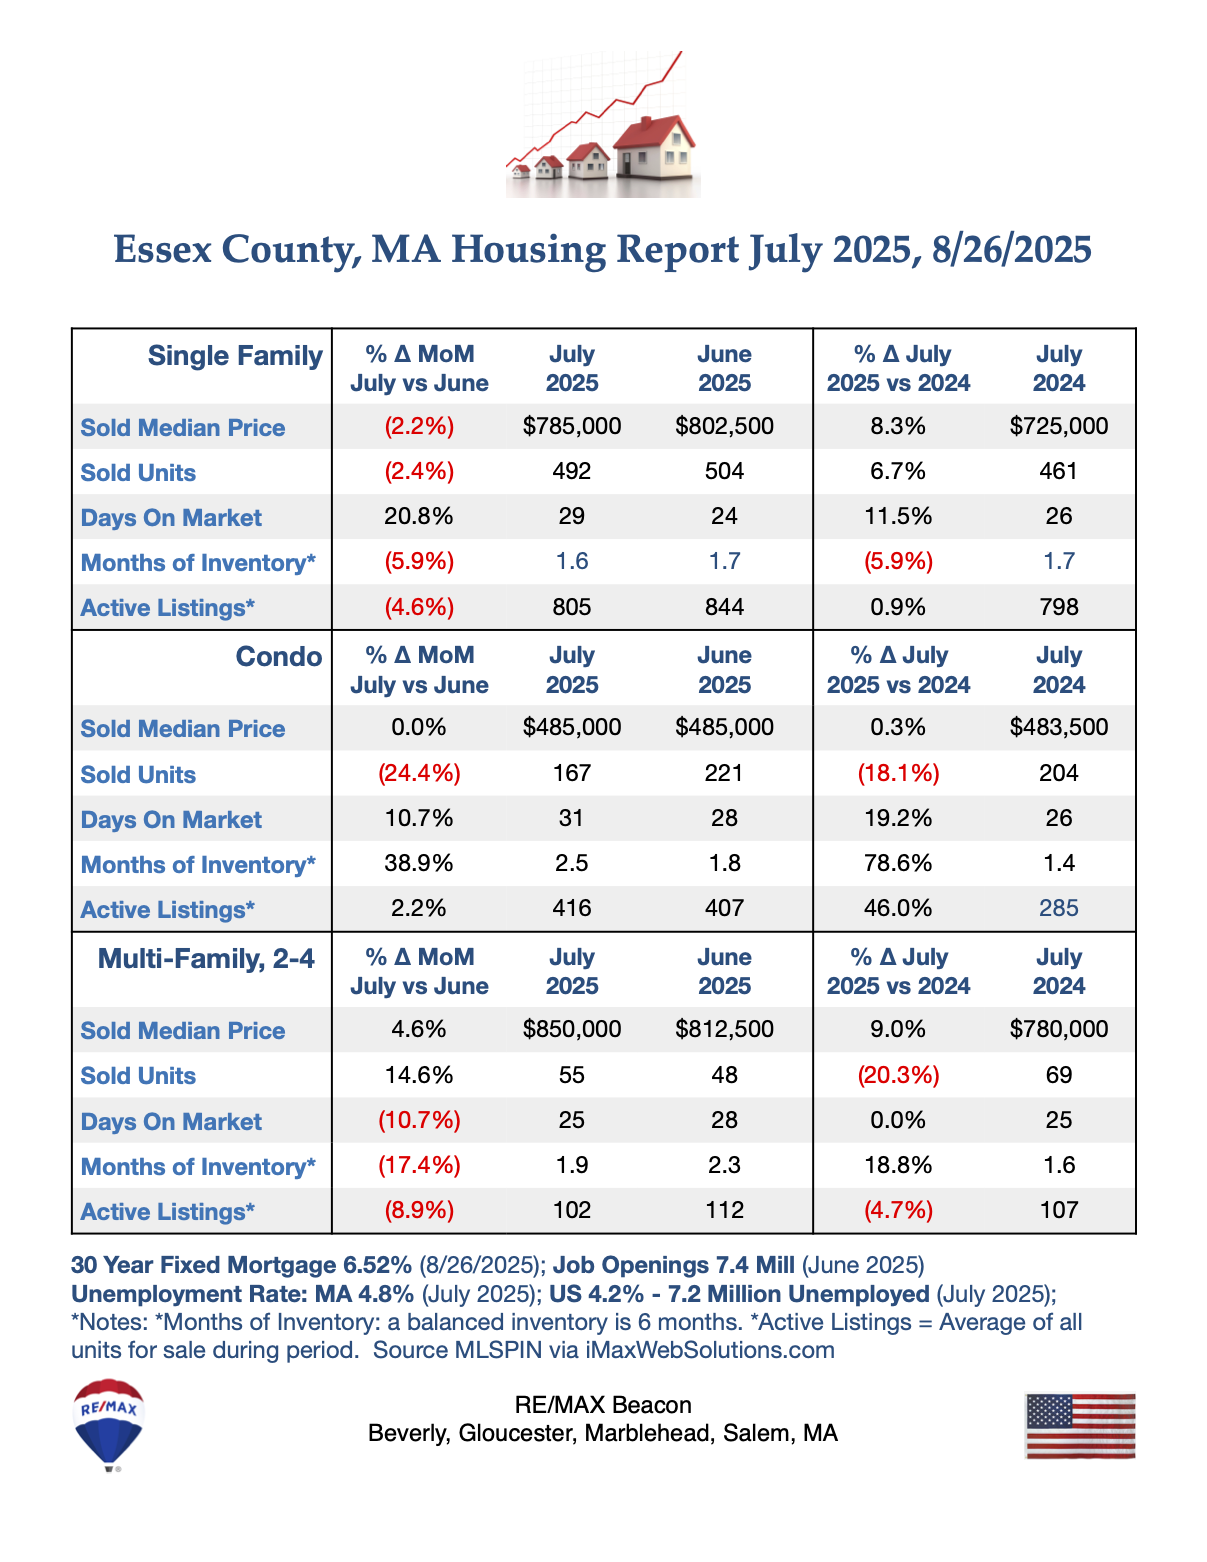
Essex County Housing Report November 2020

Essex County November Housing Report 11/12/2020 - Covid 19

Month Over Month, October 2020 vs September 2020

  • Median Sales Prices Down for Singles, Condos and Multis: Single Families -3.8%;  Condos -11.5%;  Multi-Families -11.7%
  • Unit Sales Also Down: Single Families -1.9%, and Condos -3.8%.  Multi-Families were unchanged.
  • Number of Active Listings Continue to Drop but at slower pace: Single Families -3.9%; Condos -4.8%; Multi-Families  -2.9%

Year Over Year, October 2020 vs October 2019

Essex County Housing Report Q3, 2020

Essex County Q3 Housing Report 10/9/2020 - Covid 19

Quarter Over Quarter, Q3 2020 vs Q2 2020

  • Median Sales Prices Up Strongly for all categories: Single Families +8.7%;  Condos +5.9%;  Multi-Families +11.9%
  • Unit Sales Surged for all categories:  Single Families +57.3, Condos +69% and Multi-Families +41.9%.
  • Number of Active Listings Continue to Drop: Single Families -12.9%; Condos -7.0%; Multi-Families  -18.5%

Year Over Year, Q3 2020 vs Q3 2019

  • Median Sales Prices Up Double Digit:  Single Families +14.3%; Condos +12.5%;  Multi-Families +14.1% 
  • Unit Sales were Mixed: Single Families -2.4%; Condos +10.1%; and Multi-Families -23.4%
  • Number of Active Listings Plunged: Single Families -44.7%; Condos -34.3%; Multi-Families -45.1%

 To view data for every Essex County town, go to:  http://www.sullivanteam.com/Properties/Reports/Public/Charts.php 

To dowload the full Housing Report go to: http://sullivanteam.com/pages/EssexCountyHousingReports


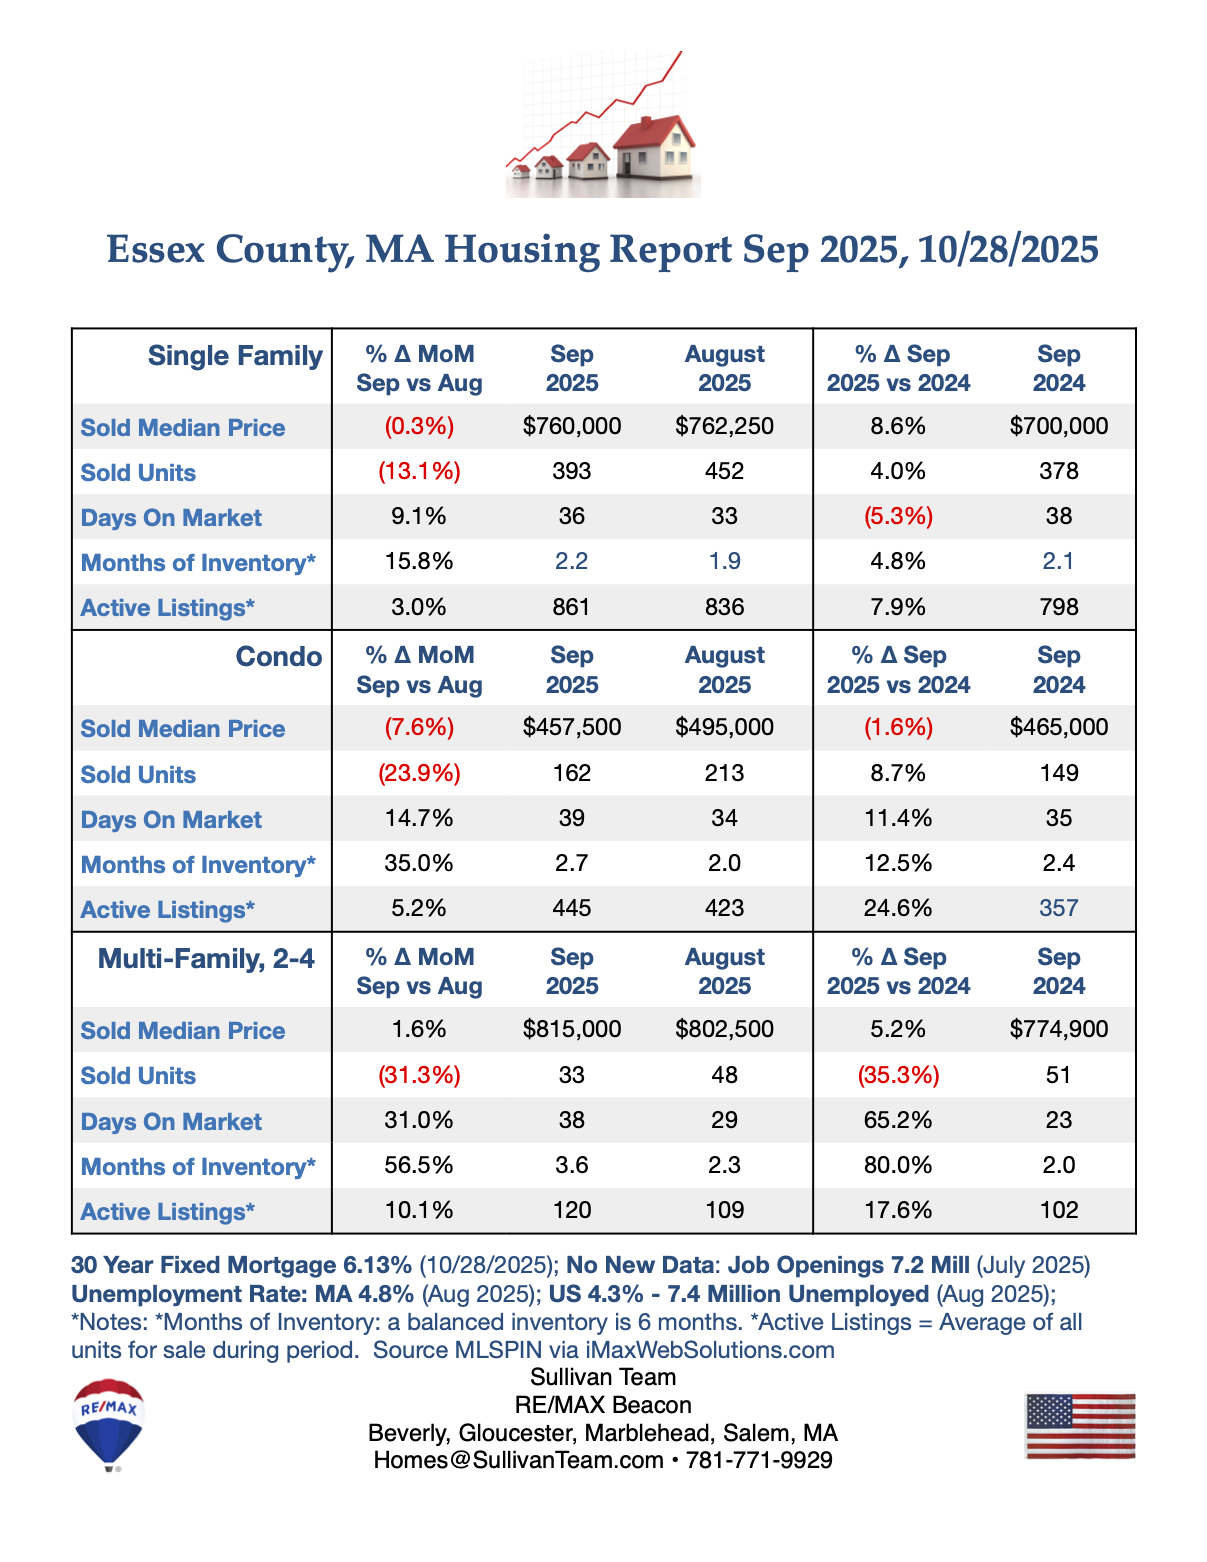
Essex County Housing Report October 2020


Essex County October Housing Report 10-9-2020 - Covid 19

Month Over Month, September 2020 vs August 2020

1. Median Sales Prices Down for Singles but Up Double Digit for Condos and Multis: Single Families -2%;  Condos +12.4%;  Multi-Families +12.5%

2. Unit Sales Down -4.3% for Single Families, Up 1.0% for Condos and Up 23.4% for Multi-Families.

3. Number of Active Listings Continue to Drop: Single Families -12.8%; Condos -5.6%; Multi-Families  -2.5%

Year Over Year, August 2020 vs August 2019

1. Median Sales Prices Up Double Digit:  Single Families +19.9%; Condos +15.4%;  Multi-Families +18% 

2. Unit Sales were up stongly for: Single Families +17.9%; Condos +19.6%; and down sharply for Multi-Families -17.7%

3. Number of Active Listings Plunged: Single Families -49.9%; Condos -36.1%; Multi-Families -46.1%


To view data for every Essex County town, go to:  http://www.sullivanteam.com/Properties/Reports/Public/Charts.php 
 
To dowload the full Housing Report go to: http://sullivanteam.com/pages/EssexCountyHousingReports
 

August Sales Blow Through Forecasts - National Sales

August Sales Blow Through Forecasts

Looking for a little clarity on this week's news? Windermere Chief Economist Matthew Gardner discusses how new home sales exceeded the annual rate of 1M units for the first time since 2006, blowing past most predictions. 

https://bit.ly/3ijd2oh


Existing-home sales

First up: Existing-home sales numbers for August blew all forecasts out the water with a significant 2.4 percent jump in sales month over month, and the annual rate of sales breaking above 6 million units. That is really impressive.

And if you’re wondering why it’s such a good number, well, the last time we hit 6 million was all the way back in December — December of 2006.


Total sales were up by a staggering 10.5 percent from a year ago, and that number is even more amazing because of this.


You see, sales rose even as the number of homes for sale continued to shrink. On an unadjusted basis, there were just 1.49 million homes for sale in August, and that’s down 0.7 percent month over month and 18.6 percent from a year ago.

But if you think that’s bad, I ran a seasonal adjustment model on the data, and it showed that the number of homes for sale in August dropped to just 1.41 million units  — and that’s the lowest level of inventory I could find on record — and my numbers go back to 1999.

But of course, the inventory numbers are just a snapshot in time because they can exclude new listings coming on during the month.

So I pored through the data and found that 69 percent of homes that sold in August were on the market for less than a month, with properties typically selling in an average of just 22 days versus 31 days during the same month a year ago. So, even though inventory levels are very low, there are still homes coming to market. But they don’t show up in the figures because they are simply selling way too quickly.

The homes that remained on the market in August tell me that there’s just three months of supply at the current sales pace, and this is down from 3.1 months in July and four months in August of 2019. This is well below the six months of supply that’s typically associated with a balanced market.

I will add that first-time buyers are still responsible for one-third of all sales, and I believe that number — which is down from 34 percent in July — would actually be much higher if one thing was different, and that’s home prices.


When we look at sale prices, the very modest pandemic-induced price drop you can see happened between April and May quickly turned around with the median sale price in August coming in at $310,600, but this chart shows the seasonally adjusted number which came in at $300,500.

And when we look at the annual percentage change in sale prices, which of course is the same for both seasonally adjusted as well as nominal prices, it’s up by a whopping 11.4 percent.


So, what’s going on?

Well, clearly there is belief in the housing market with the report showing very robust demand for existing homes, and this demand is limiting supply, which is pushing prices higher.

But there’s more.

Mortgage rate data, which I look at weekly, shows rates remaining very competitive. This is, to an extent, allowing home prices to continue to rise at above average rates. However, there isn’t much room for them to drop further.

But before you get worried about me saying that, although I don’t believe it’s likely we will see rates move significantly lower, I also don’t see rates rising significantly either. Any upward pressure on rates won’t happen this year, and I’m not expecting to see much of a move higher in 2021 either. 


Demand for housing is also supported by last week’s mortgage application numbers, which rose by 3.4 percent on the week and are now 25.1 percent higher than a year ago. But I am showing you this for another reason, and it’s that the purchase index is now at a level we haven’t seen since October of 2008.


So, it’s clear that existing homes sales are on fire with solid demand supported by very low borrowing costs. Pretty impressive. And regular viewers of my videos will know that I have been attributing some of the buoyancy in the resale market to a lack of new construction, and as luck would have it, we got the August number on new home sales last week too, so let’s take a look at those.

New home sales

Another “wow” moment. New home sales in August did something they haven’t done since November of 2006 — and that’s exceeding an annual rate of 1 million units. More precisely, they rose 4.8 percent month over month to 1.011 million sales and were up 43.2 percent year over year.


This number totally blew through everyone’s forecasts — including mine — as I was expecting the number to come in at around 890 thousand.

But if I do have a concern, it’s supply, which turned lower with only 282,000 units for sale at the end of August, and only 51,000 of those are actually completed and ready to move into.


Some of you might remember my video from last week. I told you about the massive increase in lumber prices that builders are having to cope with and that these numbers might be an indicator that increased costs are starting to impact supply. But, with that said, we did see single-family starts rise to their highest level since February of this year, so the data is still a little opaque.

New home sale prices are interesting, but not for the reasons you might expect. Builders can change the type of homes they build to meet demand and also hit a price point, and that can show up as prices actually dropping, which isn’t entirely accurate.


The data showed a big jump in sales of homes prices between $200,000 and $300,000 and an almost equally large drop in sales of homes priced between $300,000 and $400,000, and this can obviously impact the pace of price increases.

This theory is also supported when we look at sales by region, with solid demand at more affordable price points. As you see here, sales were up massively month over month in the South, which is not only the largest homebuilding region by volume, but it also has the lowest average home prices. 


So, there you have my thoughts on last week’s data releases.

In all, the reports were very solid and show housing as being the shining light in an economy that is still mired by the COVID-19 pandemic.

Looking ahead, this Tuesday, we will get the Case-Shiller data for July and also the September Consumer Confidence numbers. Pending homes sales data for August is released on Wednesday, but all eyes will be on Friday’s jobs report that will tell us what was going on in the labor market in the month of September.

Again, all interesting releases, so I hope you’ll join me again next Monday when I will give you my take on all of the numbers.

To get the big picture including all of the data, watch the full video above.

Matthew Gardner is the chief economist for Windermere Real Estate, the second largest regional real estate company in the nation.    https://bit.ly/3ijd2oh


Essex County Housing Report September 2020

Essex County September Housing Report 9/13/2020 - Covid 19

 
Month Over Month, August 2020 vs July 2020
1. Median Sales Prices Up for Singles but Flat for CC and MF: Single Families +5.5%;  Condos +0.4%;  Multi-Families +0.9%
2. Unit Sales Slow: Single Families Down -1.6%; Condos Up 3.0%;  Multi-Families Down -6.0%
3. Number of Active Listings Continue to Drop by Double Digits: Single Families -11.8%; Condos -12.3%; Multi-Families  -14.7%
 
Year Over Year, August 2020 vs August 2019
1. Median Sales Prices Up Double Digit:  Single Families +15%; Condos +11.8%;  Multi-Families +10% 
2. Unit Sales were Mixed: Single Families -10.8%; Condos +1.3%; Multi-Families -33.7%
3. Number of Active Listings Plunged: Single Families -47.7%; Condos -38.1%; Multi-Families -48.8%
 
To view data for every Essex County town, go to:  http://www.sullivanteam.com/Properties/Reports/Public/Charts.php 
 
To dowload the full Housing Report go to: http://sullivanteam.com/pages/EssexCountyHousingReports


Essex County Housing Report Q2 vs Q1

Essex County Q2 Housing Report 8/8/2020 - Covid 19

 
Q2,  2020 vs Q1 2020:  April - June 2020 vs Jan - March 2020
1. Median Sales Prices Settled Down: Single Families +5.3%;  Condos +3%;  Multi-Families -2.9%
2. Unit Sales Mixed: Single Families Up 29%; Condos Up 8.4%;  Multi-Families Down 12.9%
3. Number of Active Listings Mixed: Single Families +19.6%; Condos +4.3%; Multi-Families  -2%
 
Year Over Year, Q2 2020 vs Q2 2019
1. Median Sales Prices Up:  Single Families +8.4%; Condos +8.2%;  Multi-Families +7.4% 
2. Unit Sales Plunged: Single Families -25.1%; Condos -32.9%; Multi-Families -39.1%
3. Number of Active Listings Plunged: Single Families -34.9%; Condos -28.2%; Multi-Families -27.6%
 
To view data for every Essex County town, go to:  http://www.sullivanteam.com/Properties/Reports/Public/Charts.php 
 
To dowload the full Housing Report go to: http://sullivanteam.com/pages/EssexCountyHousingReports


Essex County Housing Report August 2020

Essex County August Housing Report 8/8/2020 - Covid 19

 
Month Over Month, July 2020 vs June 2020
1. Median Sales Prices Settled Down: Single Families +2.8%;  Condos -0.4%;  Multi-Families -1.4%
2. Unit Sales Surged: Single Families Up 30.2%; Condos Up 27.2%;  Multi-Families Up 37.5%
3. Number of Active Listings Plunged: Single Families -19.9%; Condos -13.1%; Multi-Families  -15.6%
 
Year Over Year, July 2020 vs July 2019
1. Median Sales Prices Up:  Single Families +7.9%; Condos +11.3%;  Multi-Families +11.9% 
2. Unit Sales Mixed: Single Families -9.4%; Condos +9.3%; Multi-Families -20.5%
3. Number of Active Listings Plunged: Single Families -49.8%; Condos -36.6%; Multi-Families -52.2%
 
To view data for every Essex County town, go to:  http://www.sullivanteam.com/Properties/Reports/Public/Charts.php 
 
To dowload the full Housing Report go to: http://sullivanteam.com/pages/EssexCountyHousingReports
 

Essex County Housing Report July 2020


Essex County July Housing Report 7/9/2020 - Covid 19

 
Month Over Month, June 2020 vs May 2020
1. Median Sales Prices Have Big One Month Gains: Single Families +8.2%;  Condos +4.5%;  Multi-Families +7.6%
2. Unit Sales Have Big Moves: Single Families Up 18.1%; Condos Up 63.8%;  Multi-Families Down 14.8%
3. Number of Active Listings Mixed: Single Families Down -3.5%; Condos Up 1.4%; Multi-Families Down -19.4%
 
Year Over Year, June 2020 vs June 2019
1. Median Sales Prices Up:  Single Families +7.1%; Condos +11.3%;  Multi-Families +9.0% 
2. Unit Sales Plunged: Single Families -26%; Condos -18.4%; Multi-Families -44.6%
3. Number of Active Listings Plunged: Single Families -45.6%; Condos -34.8%; Multi-Families -50.9%
 
To view data for every Essex County town, go to:  http://www.sullivanteam.com/Properties/Reports/Public/Charts.php 
 
To dowload the full Housing Report go to: http://sullivanteam.com/pages/EssexCountyHousingReports


Essex County Housing Report June 2020

May housing results impacted by Covid-19

Essex County June Housing Report 6/6/2020 - Covid 19

 
Month Over Month, May 2020 vs April 2020
1. Median Sales Prices Softened: Single Families Down -2%;  Condos Down -1.5%;  Multi-Families Up 0.2%
2. Unit Sales Big Moves: Single Families Up 21.7%; Condos  Down -16.6%;  Multi-Families Up 15.2%
3. Number of Active Listings Mixed: Single Families Down -0.8%; Condos Up 2.4%; Multi-Families Down -21.6%
 
Year Over Year, May 2020 vs May 2019
1. Median Sales Prices Rose At Slower Pace:  Single Families  Up 3.2%; Condos Up 0.8%;  Multi-Families Up 6.6% 
2. Unit Sales Plunged: Single Families -29.5%; Condos -49.3%; Multi-Families -38.4%
3. Number of Active Listings Plunged: Single Families -47.5%; Condos -35.9%; Multi-Families -45.3%
 
To view data for every Essex County town, go to:  http://www.sullivanteam.com/Properties/Reports/Public/Charts.php 
 
To dowload the full Housing Report go to: http://sullivanteam.com/pages/EssexCountyHousingReports