Thumbnail Slider

Planning Your 2026 Real Estate Moves: A Guide to the Best Buying and Selling Seasons


Planning Your 2026 Real Estate Moves: A Guide to the Best Buying and Selling Seasons

Timing isn’t everything in real estate, but it can mean the difference between saving $20,000 or paying a premium, selling in 30 days or waiting three months, and negotiating from a position of strength or uncertainty.

As we look toward 2026, understanding seasonal patterns has become more critical than ever. With inventory levels normalizing and market conditions continuing to evolve, knowing when to make your move can dramatically impact your outcome. Whether you're a first-time buyer watching every dollar or a seller trying to maximize your profit, the season you choose matters.

The challenge? Not everyone can wait for the "perfect" time. Job relocations happen in January. A growing family needs more space in July. Retirement doesn’t wait for spring. This guide breaks down the pros and cons of each season so you can make the smartest decision within your timeline.

Spring: Peak Selling Season (March-May)

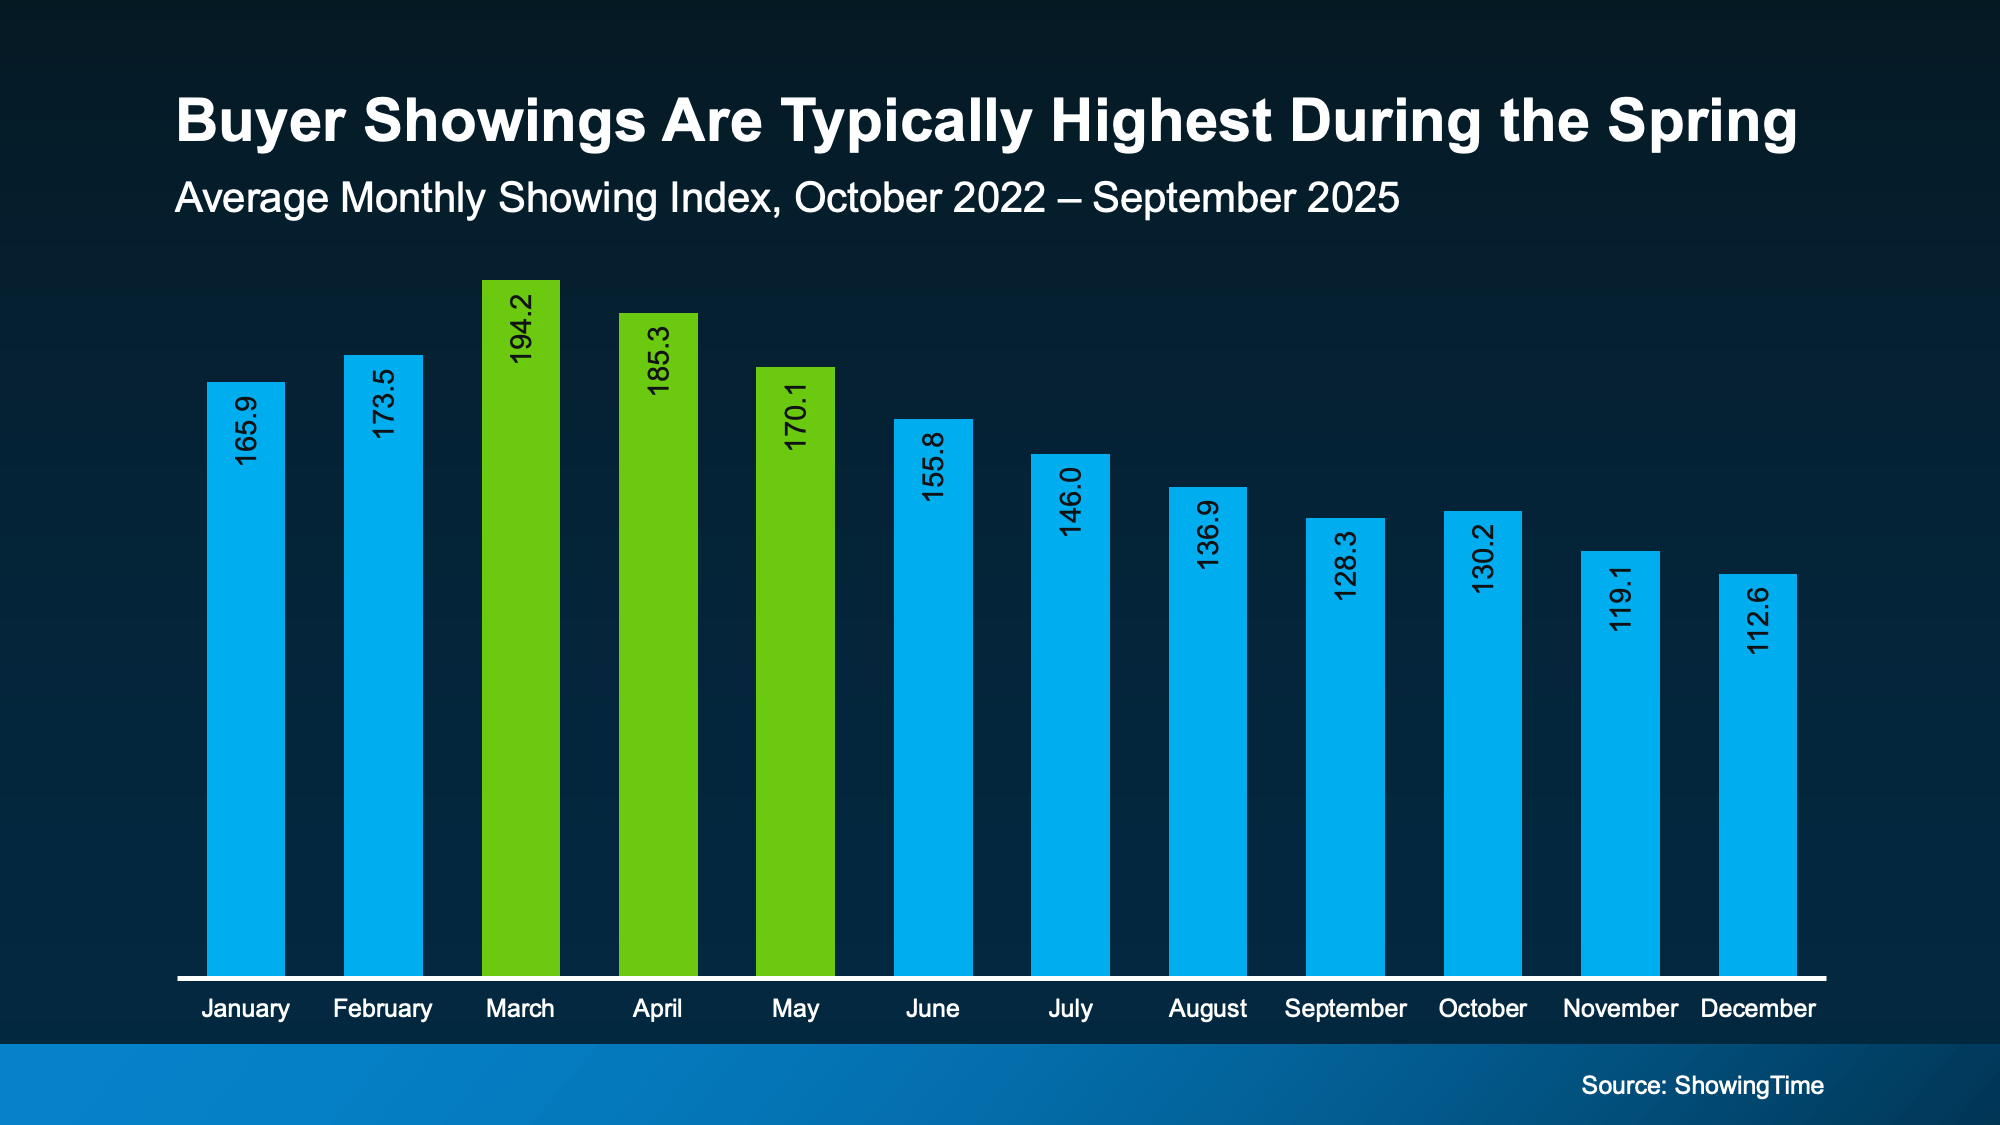
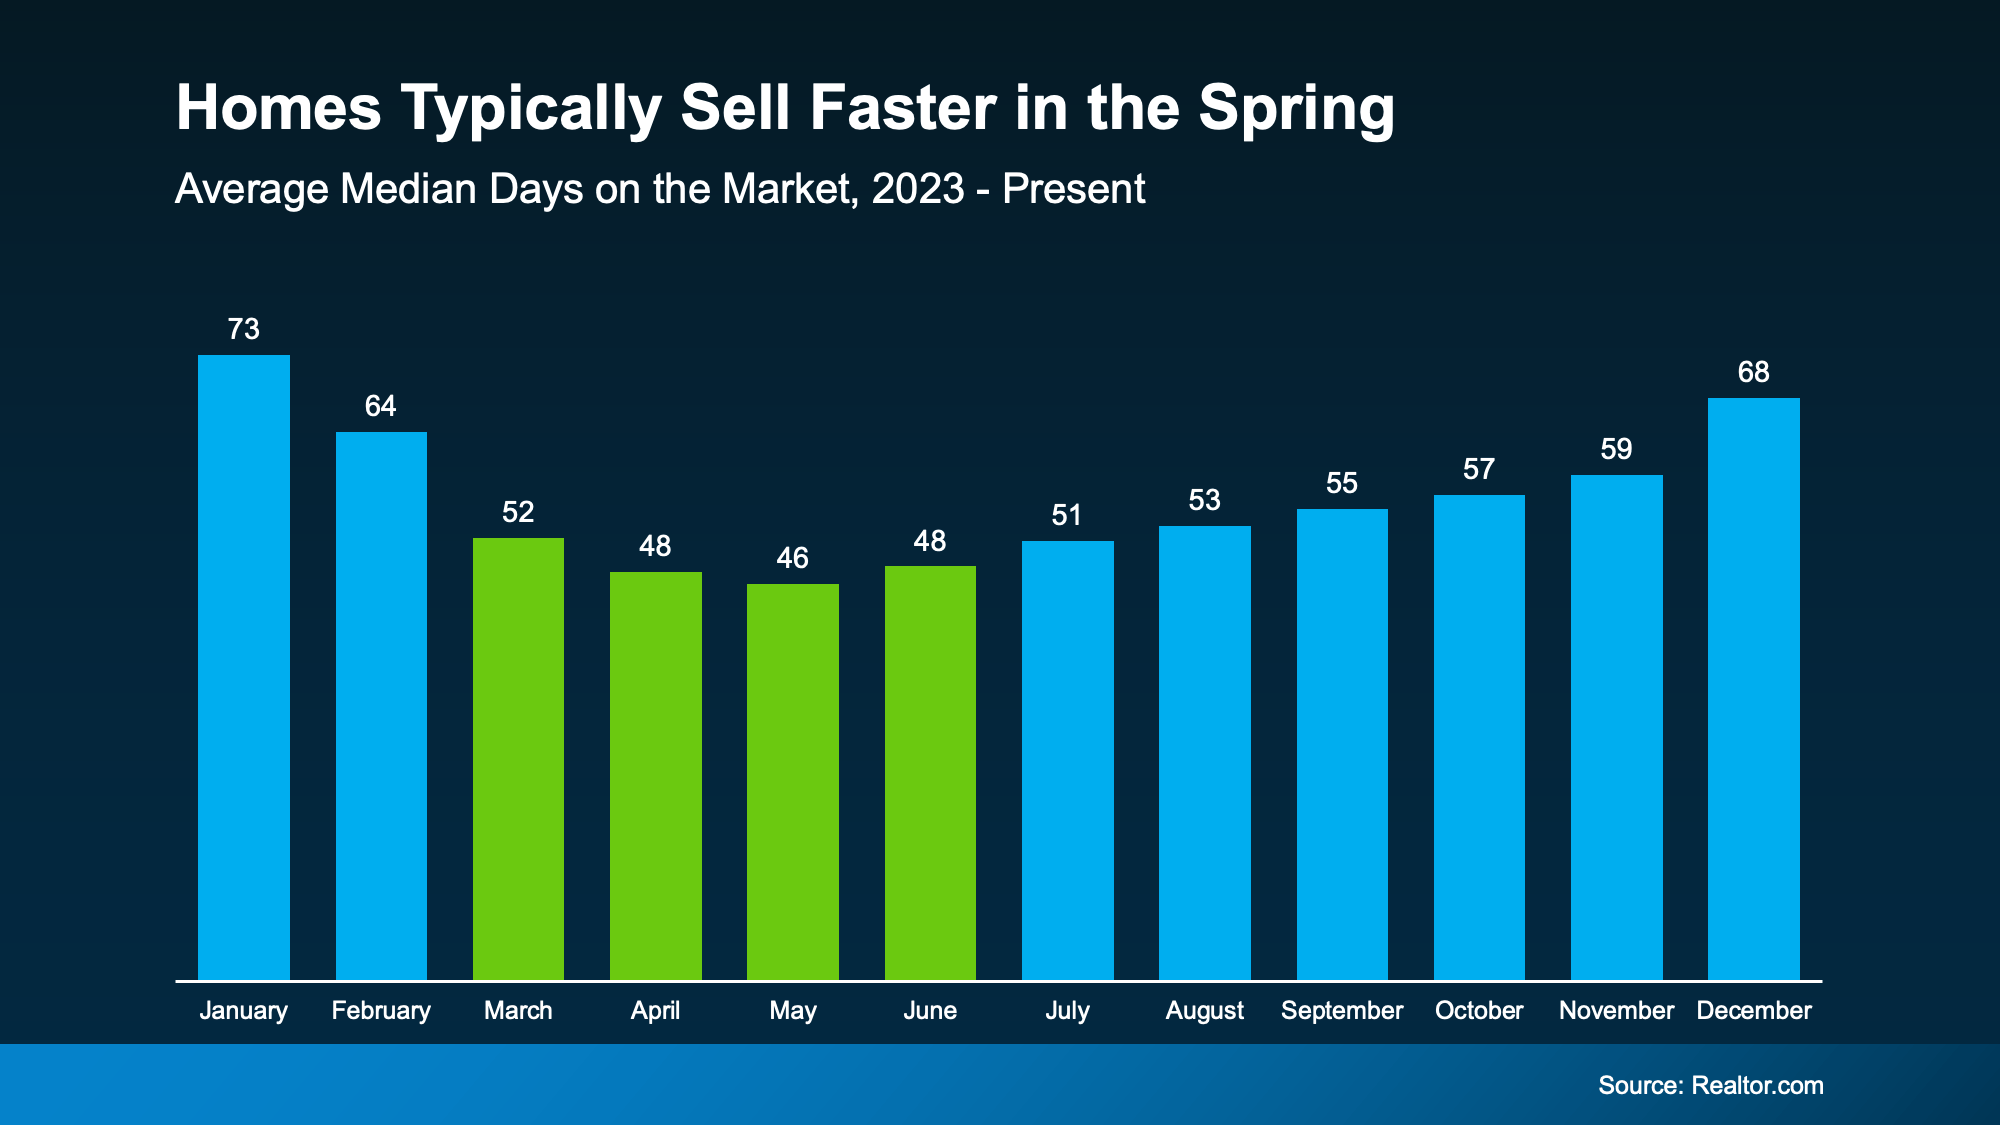
Spring isn’t called peak season by accident. The housing market comes alive with energy that is impossible to ignore. Data shows homes listed in spring sell in as few as 33 days, compared to 49 days in winter.1 May also offers the highest seller premium, 13.1% above market value, translating to faster sales and higher returns.2

Buyer psychology also plays a role. Warmer weather encourages open house attendance, longer daylight allows more viewings, and families aim to move before school starts, creating urgency. Spring blooms and greenery boost curb appeal in ways winter staging cannot match.3

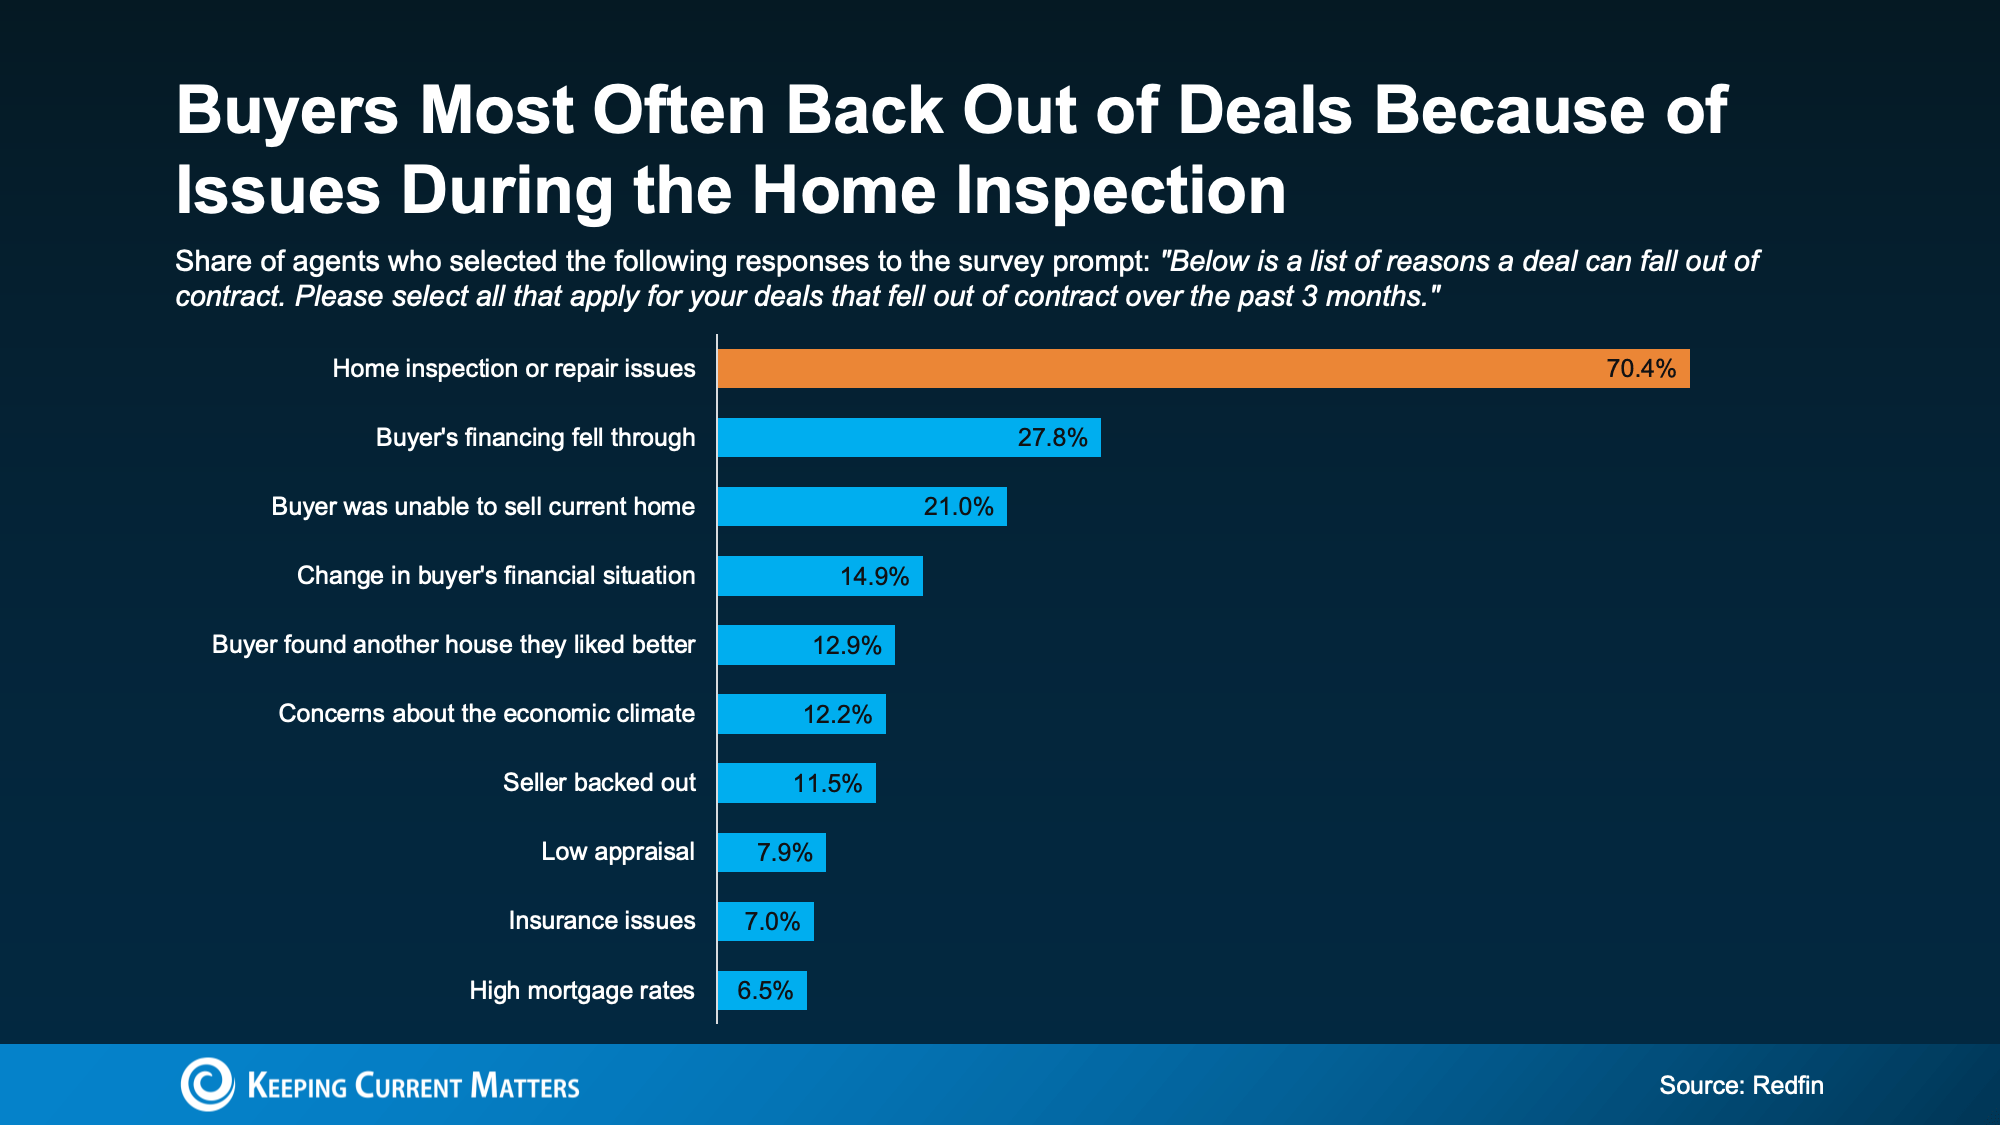
The Competition Factor

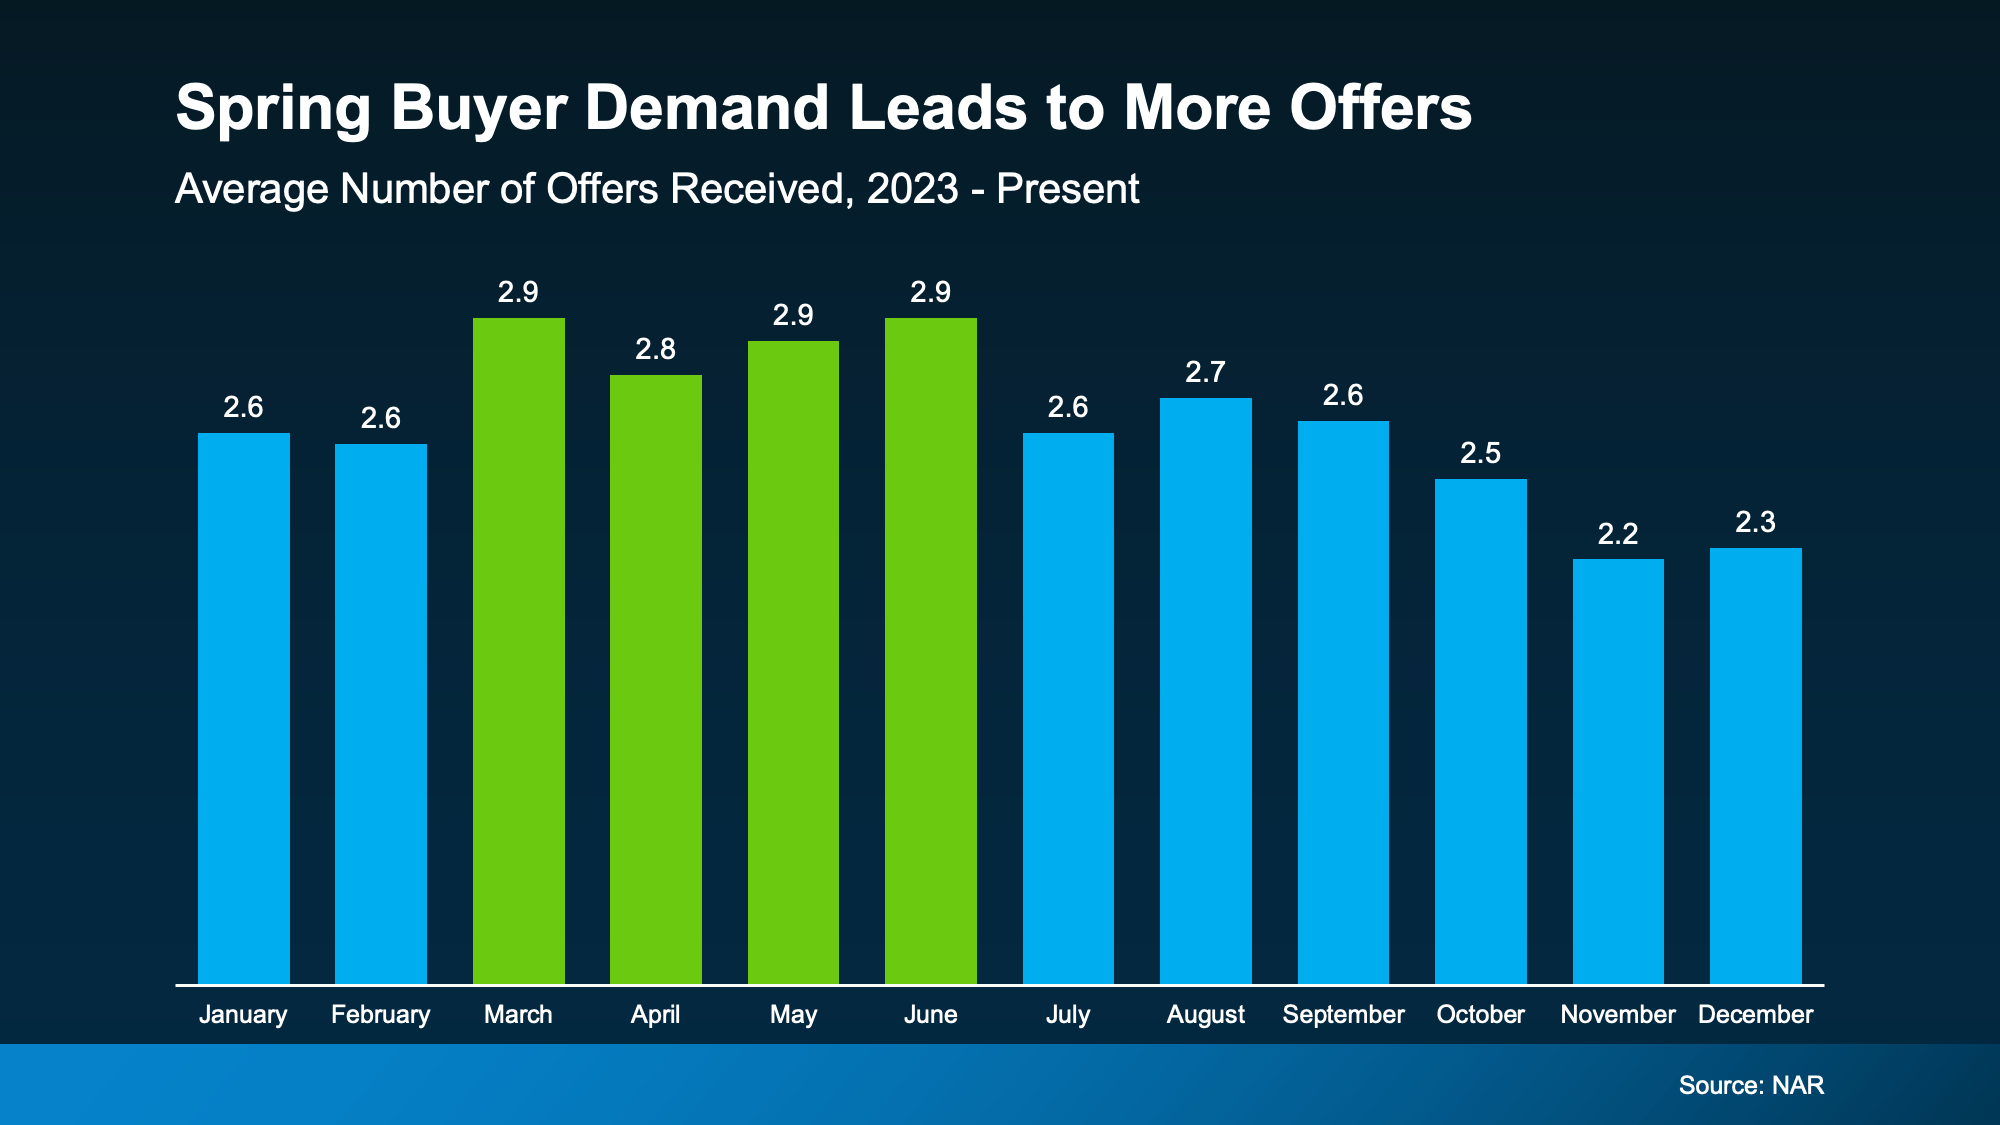
The trade-off is that spring’s advantages come with more competition. Sellers must make their homes stand out, pricing correctly, staging well, and marketing aggressively. Buyers benefit from the largest inventory, with new properties listed weekly, but face higher competition. In May and June, 35% of buyers pay above list price compared to 24% in January, making bidding wars common and increasing pressure to decide quickly.4

Summer: Extended Peak Season (June-August)

As spring transitions to summer, the market maintains its momentum. June often sees the highest sales volume of the year, with more than 16,500 homes selling per day.1

The Family Timeline

Summer’s appeal aligns with family schedules, as school breaks let children move without disrupting education. Warm weather and long days make moving easier and provide ample time for viewings. Outdoor spaces like pools, patios, and landscaping are at their best. Higher prices and sales activity reflect the premium buyers pay for peak-season convenience.

Late Summer Shifts

By August, changes appear. Unsold spring or early summer listings may become “stale,” and buyers begin settling as school starts. Competition eases slightly, though prices stay high, making it a transition month where patient buyers can benefit.

A practical concern is moving costs, which peak in summer due to high demand. Nearly half of all household moves occur between June and August, increasing competition for movers and rental trucks alike.5

Fall: Underrated Opportunity Season (September-November)

Fall might be real estate's best-kept secret. While conventional wisdom suggests spring is the only time to transact, savvy buyers and sellers increasingly recognize fall's unique advantages.

Less Competition, More Serious Players

Data shows a large share of home sales occur in the fall, a detail often overlooked. With fewer competing sellers, listings stand out more, and active buyers tend to be serious and ready to act quickly.3

October typically offers the best conditions for buyers. Data shows it has one of the lowest seller premiums of the year—about 8.8% above market value—as demand cools and competition eases.2 Home prices also tend to dip slightly from summer highs, saving buyers thousands compared to peak-season purchases.4 For first-time buyers especially, fall can be an ideal time to find value without the bidding wars of spring and summer.

The Urgency Factor

Fall brings natural urgency. Buyers aim to close before holidays and bad weather, while sellers may be motivated by taxes or avoiding a winter listing. Comfortable weather in many areas makes showings easier.

Fall buyers are often more decisive, with fewer casual browsers and more serious purchasers ready to negotiate.

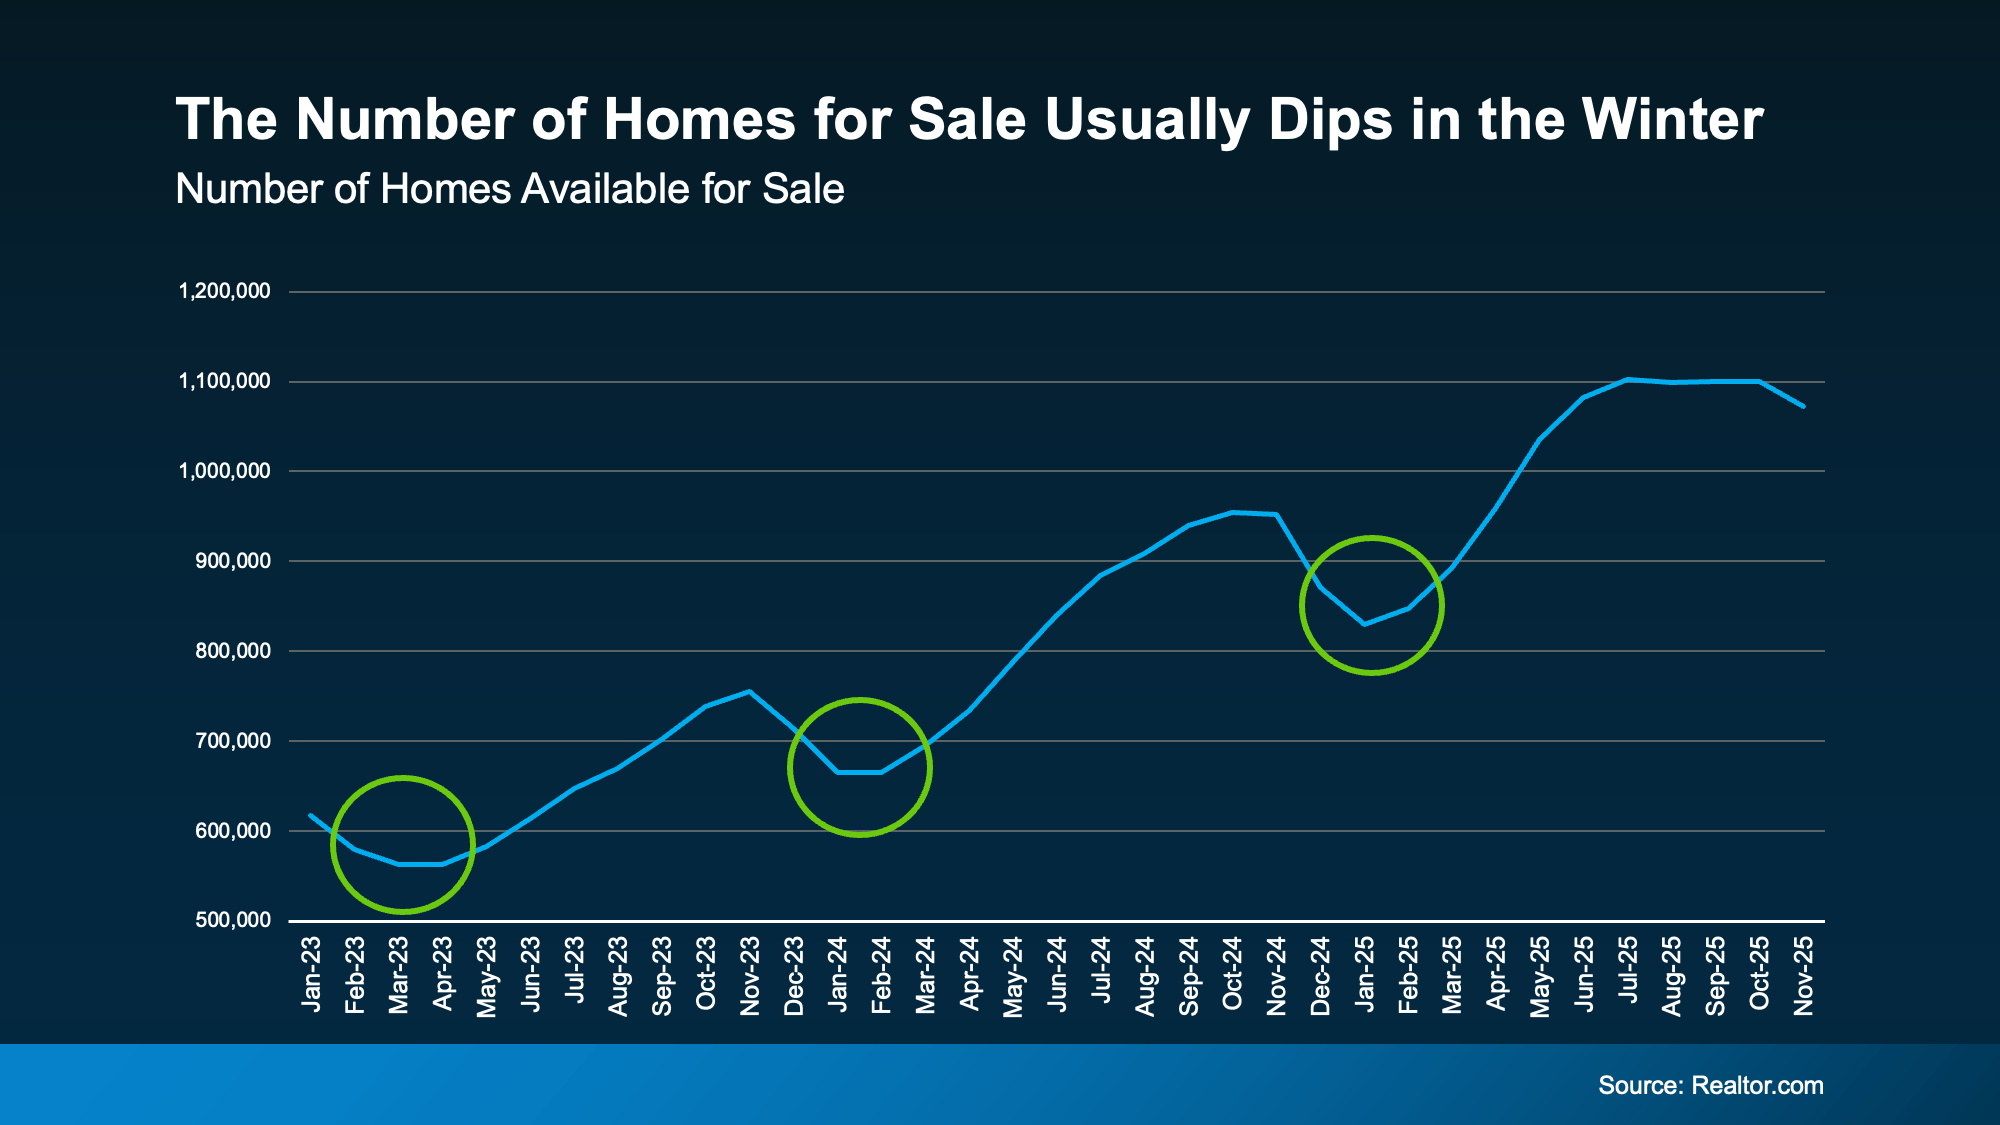
Winter: Value Season (December-February)

Winter gets a bad reputation in real estate, but for buyers with flexibility, it offers the year's best value proposition.

The Numbers Don’t Lie

The low-competition environment in winter provides the best opportunity for buyers to secure a discount. In January, only 24% of buyers pay above list price compared to 35% in May and June, which greatly reduces the chance of bidding wars.4 This lower competition also means winter homes stay on the market longer, averaging 49 days versus 31 days during peak season, giving buyers more time, less pressure, and stronger negotiating power.1 Motivated sellers become more flexible as the holidays pass. Moving companies also offer their lowest rates in winter.

Winter’s Challenges

Winter has trade-offs. Sellers face the lowest buyer traffic, holiday distractions, limited curb appeal from dormant landscaping, and shorter daylight for showings.

Yet winter offers advantages. Less competition can help if you price aggressively and present well, and buyers who do visit are highly motivated, often relocating for jobs. Warm-climate markets like Florida and Arizona see smaller winter slowdowns, making location important.1

Snow and ice create safety hazards, and cold weather makes moving harder. However, winter also reveals property truths, such as heating efficiency, drafty windows, and roof performance, which is all information savvy buyers use during inspections.


Regional Differences: Not All Markets Are Equal

Seasonal changes in the real estate market depend heavily on location, meaning a strategy that works in one city may fail in another. Markets in the Midwest and Northeast experience the most dramatic seasonal swings due to harsh winters, which push most activity into the short window between May and August. For example, daily home sales in the Midwest often more than double from January to June, with states like Illinois and Ohio seeing significant annual price swings.

In contrast, Southern and Western markets enjoy stable, year-round activity because of mild weather. Places like California and most of the South see much less severe slowdowns in winter. The exception markets are those where mild winter weather attracts buyers, like Phoenix, Arizona, where the best selling time is late November. Understanding these local patterns is crucial, as local market dynamics always matter more than general national statistics. Feel free to reach out if you would like to know more about the specific seasonal patterns in your local area.


Pricing Strategies by Season

Pricing strategy must adapt to seasonal realities. What works in May fails in December, and vice versa.

Spring and Summer Pricing

During peak season, competitive pricing often attracts multiple offers. Pricing strategically 10–15% below comparable sales can spark competition and push final offers above list. Psychological pricing also matters; listing slightly under round numbers ($349,000 instead of $350,000) increases online visibility and appeals to buyer behavior. Emphasizing seasonal features such as outdoor spaces, natural light, and blooming gardens helps justify premium pricing.3

Fall Reality Check

As competition declines in fall, pricing should be more realistic. Listing slightly below spring comparables can help generate activity. Flexibility on price attracts serious year-end buyers eager to close before the holidays and bad weather. Recognizing buyer urgency allows you to price strategically rather than reactively.2

Winter Aggression

Winter requires more aggressive pricing to attract a smaller buyer pool. Pricing 5–10% below spring values can create immediate interest. Motivated sellers should focus on value over premium pricing. Buyers shopping in January aren’t bargain hunters, they’re seeking homes that justify moving during an inconvenient season.1

Year-round best practices stay consistent: use a Comparative Market Analysis, consider current market conditions, account for unique property features that algorithms may overlook, and monitor comparable sales while staying open to adjustments.


Buyer Offer Strategies by Season

Spring and Summer Competition

Peak season requires quick, confident action. Get pre-approved to show you’re a serious buyer and be ready to move fast. Consider offering above asking price when you find the right property, and use an escalation clause to outbid competitors up to your limit. Flexible closing dates also strengthen your offer. Some buyers write personal letters to create emotional connections.

Fall and Winter Leverage

Negotiating power shifts with the seasons. In fall and winter, when seller competition drops and buyer pools shrink, you gain leverage. You can more easily request seller concessions such as closing costs, home warranties, repairs, or even appliances and fixtures. Use inspection results to negotiate price reductions, as motivated sellers grow more flexible later in the season. You can also request longer inspection periods and winter move-in credits.¹

Year-Round Negotiation Fundamentals

No matter the season, understanding the seller’s motivation is key. Support your offer with market data rather than emotion, and build rapport when possible. Stay calm and avoid emotional decisions.

Have your agent handle offers and counteroffers to reduce tension. Know your limits and walk away from deals that don’t fit your goals. In buyer’s markets, be assertive; in seller’s markets, make offers strong and decisive. The fundamentals stay the same, though their intensity shifts with the season.


BOTTOMLINE

Seasonality creates opportunities and challenges, but personal circumstances should drive timing. Spring/early summer brings the highest prices and fastest sales. Winter offers buyers the best deals. Waiting for the “perfect” season doesn’t help if life demands action.

Understanding your specific situation, timeline, and goals allows us to create a customized strategy that maximizes outcomes within your constraints. The best time to move is when it's right for you.


Sources

1.      National Association of REALTORS®. Navigating the Housing Market: A Seasonal Perspective. 2024.
https://www.nar.realtor/blogs/economists-outlook/navigating-the-housing-market-a-seasonal-perspective

2.      Bankrate. Best Time to Sell a House. 2024
 https://www.bankrate.com/real-estate/best-time-to-sell-house

3.      Investopedia. How Seasons Impact Real Estate More Than You Think. 2024.
https://www.investopedia.com/articles/investing/010717/seasons-impact-real-estate-more-you-think.asp

4.      Zillow
https://www.zillow.com/learn/best-time-to-buy-a-house/

My Moving Journey
https://mymovingjourney.com/blogs/moving-in-peak-season-vs-off-season

Essex County Housing Report November 2025, 12/23/2025

Essex County Housing Report November 2025, 12/23/2025

Nationally - Stable but Subdued Growth in Prices and Sales

Unit sales for homes and condos rose +0.7% from 4.10M sales in October 2025 to 4.13M in November 2025. However, median prices fell 2.4% for this period from $415,200 in October to $409,200 in November. Days on market rose from 34 to 36 days and inventory fell slightly from 4.4 months to 4.2 months. 21.2% of active listings had price reductions in November vs 26.9% in October 2025.

Essex County - Unit Sales Fell for Singles and Condos and Prices Fell for Single Families and were Flat for Condos. Inventory remains very low. 27% of active listings had a price reduction in November 2025.

Single Family unit sales fell 8.8% month over month to 385 but rose 2.1% year over year. Median Prices fell 8% to $690,000 from October 2025 and fell 1.4% year over year. Condo Units sales fell 18.4% from October 2025 to 164 units but rose 2.5% year over year. Condo median prices rose 1% from October 2025 to $467,500 and rose 0.8% year over year. Inventory is only 1.9 months for Single Families and 2.6 months for Condos.

To view data for every Essex County town,


Why Selling Your House This Winter Gives You an Edge

Why Selling Your House This Winter Gives You an Edge 


Spring gets all the attention, but it’s not always the best time to sell a house. Yes, more buyers show up, but so do a lot of other sellers.

Winter is different. With fewer homes on the market, your house has a much better chance of standing out. And that one advantage can make a big difference.

Winter Is When Your Listing Stands Out

History shows the number of homes for sale tends to drop during the winter months. It’s a trend that’s predictable almost every year.

Data from Realtor.com shows this pattern clearly. Inventory dips in the winter (the green circles in the graph below), then climbs again as soon as spring approaches:

a graph with green circles and numbers


And based on the latest data available, it looks like that pattern may be true again in 2025. The graph shows the supply of homes for sale is starting to come down as we head into the end of the year. And if history is any indicator of where it goes next, it’ll continue to fall just like it usually does.

Here’s why knowing this gives you an edge. 

While inventory is higher now than it’s been in the last few years, there are still not as many homes for sale as there’d be in a normal market (2017-2019). And we may even be poised for inventory to dip a bit as the weather cools.

That gives you an opportunity. If you work with an agent to list now, you’ll sell while other homeowners are taking their homes off the market and before the number of homes for sale climbs this spring.

Less competition from other sellers now = more attention on your house this season.

Why wait until everyone else lists in the spring when you can get ahead of the crowd?

Winter Buyers Are Serious Buyers

Another big perk is the buyers looking right now usually need to move.

They’re not just browsing for fun. They’re relocating for work, dealing with a lease ending, making a big life change, or simply ready to move forward sooner rather than later. As U.S. News explains:

“. . . buyers who are trudging through wintry weather often have a good reason for being out in the cold – they need to move. Whether it’s a relocation for a new job, a divorce or the arrival of a new baby, buyers who brave the elements are usually serious and able to make quick decisions.

That means fewer weekend wanderers and more highly motivated, qualified buyers walking through your door.

And since we know inventory usually drops this time of year, odds are they’ll have a little less to choose from compared to the fall. If you price and prep your house right, maybe your house will be the one that catches their eye.

Bottom Line

Winter might not get the same buzz as spring, but that’s exactly why it works in your favor. Less competition from other sellers, more motivated buyers, and a chance for your house to truly stand out.

If you’re thinking about selling, this season can give you a real advantage. Let’s connect and talk through what listing now could look like for you.

Housing Report October 2025, 11/25/2025

Housing Report October 2025, 11/25/2025

Nationally - Market continues to Stabilize
Nationally, October unit home sales (single-family and condos) rose +1.2% year over year to 4.1 Million units, up slightly from 4.06 million units in September 2025. October home prices rose +2.1% year over year to $415,200, unchanged from September 2025. Days on market rose to 34 days from 33 days in September and 29 days in October 2024. Months of inventory fell to 4.4 months from 4.6 months in September but rose from 4.0 months in October 2024. October sales improved slightly as inventory rose and 22.5% of homes had price reductions in October. Homes were selling for 98.5% of list price down slightly from October 2024. 

Essex County - Market Normalizing but Inventory Remains Low.
Unit sales recovered nicely in October from September, but are still down year over year -2.8% for single families and -1.0% for condos. Year over year, single family median prices rose +2.7% and Condo prices fell -4.5%. Single family homes are now selling for 100.5% of asking price, condos are selling for 99.2% of asking price and 35.7% of all homes for sale (singles and condos) had a price reduction as days on market increased slightly and mortgage interest rates remain elevated, now 6.25%.

To view data for every Essex County town,


Housing Report September 2025, 10/28/2025

Housing Report September 2025, 10/28/2025


Bottom Line: Nationally - Market is slowing down / stabilizing

Nationally, home prices declined -1.8% to $415,200 from August to September but rose +2.1% from September 2024. Month over month unit sales rose +1.5% to 4.06 million and year over year rose +4.1%. Days on market rose to 33 days from 31 days August 2025 and 28 days in September 2024. Months of inventory remained at 4.6 months in September but rose from 4.2 months in September 2024. September sales improved slightly as mortgage rates eased, active listings rose to 1.1 million up 17% year over year and 19.9% of active listings had price reductions.

Bottom Line: Essex County - Market is Slowing

From August to September 2025, home / condo prices and units sold fell and the number of active listings and days on market rose. Year over year, single family home prices rose but condo prices fell. Units sold and active listings rose for homes / condos and days on market fell for homes but rose for condos. 12.2% of September’s active listings had a price reductions. 30 Yr Mortgage rate averaged 6.3% in September. Today’s rate is 6.13% (Mortgage News Daily).

To view data for every Essex County town,


2026 Housing Market Outlook

2026 Housing Market Outlook - Keeping Current Matters


After a couple of years where the housing market felt stuck in neutral, 2026 may be the year things shift back into gear. Expert forecasts show more people are expected to move – and that could open the door for you to do the same.

More Homes Will Sell

With all of the affordability challenges at play over the past few years, many would-be movers pressed pause. But that pause button isn’t going to last forever. There are always people who need to move. And experts think more of them will start to act in 2026 (see graph below):

a graph of a graph showing the number of the company's salesWhat’s behind the change? Two key factors: mortgage rates and home prices. Let’s dive into the latest expert forecasts for both, so you can see why more people are expected to move next year.

Mortgage Rates Could Continue To Ease

The #1 thing just about every buyer has been looking for is lower mortgage rates. And after peaking near 7% earlier this year, rates have started to ease.

The latest forecasts show that could continue throughout 2026, but it won’t be a straight line down (see graph below):

a graph with numbers and linesThere’s a saying: when rates go up, they take the escalator. But when they come down, they take the stairs. And that’s an important thing to remember. It’ll be a slow and bumpy process.

Expect modest improvement in mortgage rates over the next year but be ready for some volatility. There will be volatility along the way as new economic data comes out. Just don't let it distract you from the bigger picture: the overall trend will be a slight decline. Forecasts say we could hit the low 6s, or maybe even the high 5s.

And remember, there doesn't have to be a big drop for you to feel a change. Even a smaller dip helps your bottom line.

If you compare where rates are now to when they were at 7% earlier this year, you’re already saving hundreds on your future mortgage payment. And that’s a really good thing. It’s enough to make a real difference in affordability for some buyers.

Home Price Growth Will Be Moderate

What about prices? On a national scale, forecasts say they’re still going to rise, just not by a lot. With rates down from their peak earlier this year, more buyers will re-enter the market. And that increased demand will keep some upward pressure on prices nationally – and prevent prices from tumbling down.

So, even though some markets are already seeing slight price declines, you can rest easy that a big crash just isn’t in the cards. Thanks to how much prices rose over the last 5 years, even the markets seeing declines right now are still up compared to just a few years ago.

Of course, price trends will depend on where you are and what’s happening in your local market. Inventory is a big driver in why some places are going to see varying levels of appreciation going forward. But experts agree we’ll see prices grow at the national level (see graph below): 

a graph of green rectangular objectsThis is yet another good sign for buyers and overall affordability. While prices will still go up nationally, it’ll be at a much more sustainable pace. And that predictability makes it easier to plan your budget. It also gives you peace of mind that prices won’t suddenly skyrocket overnight.

Bottom Line

After a quieter couple of years, 2026 is expected to bring more movement – and more opportunity. With sales projected to rise, mortgage rates trending lower, and price growth slowing down, the stage is set for a healthier, more active market.

So, the big question: will you be one of the movers making 2026 your year?

Let’s connect if you want to get ready.

Essex County Housing Report July 2025, 8/26/2025

Housing Report July 2025, 8/26/2025


Bottom Line: Nationally - Market is slowing down

Nationally, the U.S. housing market is showing signs of a slowdown as affordability remains a widespread challenge. Price growth is sluggish, rising only 1.9% year over year and declining 0.3% month over month; inventory is growing and months of inventory is now 4.6 month; houses are staying on the market longer, an average of 58 days; and price cuts remain prevalent with over 20% of active listings having a price reductions in June and July.

Bottom Line: Essex County - Housing Demand is moderating as prices rise.

From June to July, Single Family median sold prices and units sold fell and days on market rose. Condo sold prices were flat, unit sales fell and days on market rose. Year over year Single Family and Condos prices rose but unit sales fell for condos and days on market increased for both. Inventory remains low, 1.6 months for Single Family and 2.5 months for Condos, giving sellers an advantage. Happily, the Federal Reserve indicated a rate cut in September which indirectly helps mortgage rates.

30 year Mortgage rate for July averaged 6.72%.  Today’s mortgage rate is 6.52% (Mortgage News Daily). 

To view data for every Essex County town,

Essex County Housing Report August 2025, 9-22-2025

Housing Report August 2025, 9/22/2025


Bottom Line: Nationally - Market is slowing down / stabilizing

Nationally home values are increasing at a slower pace. Median prices in August rose 1.9% year over year and fell -0.8% from July 2025 to August 2025.  Houses are staying on the market longer, 47 days in August 2025 vs 39 days a year earlier.   Housing Inventory is now 5 months, almost a balanced market, but this varies by region.  Affordability remains a major buyer concern resulting in buyers shifting to smaller, more affordable homes with lower maintenance. Happily, mortgage rates are trending lower.

Bottom Line: Essex County - Houses and Condos Not in Synch.

From July to August single family home prices and units sold fell, but days on market rose.  However, Condo prices, units sold and days on market all rose. 
Year over year, single family home prices rose, units sold fell, and days on market unchanged.  But, Condo prices fell, and units sold and days on market both rose.  

Inventory still remains very low, giving sellers an edge if property is reasonably priced. 

30 year Mortgage rate for July averaged 6.56%.  Today’s mortgage rate is 6.35% (Mortgage News Daily). 

To view data for every Essex County town,


Essex County Housing Report June 2025, 7/21/2025

Essex County Housing Report June 2025, 7/21/2025

Bottom Line: 

June 2025 Units Sold and Median Sold Price rose both year over year and month over month for Single Families, Condos and 2-4 Unit Multi-families.  As expected, the number of Active Listings increased from May to June

The market still favors sellers as inventory remains low, around 2 months.  As 71.3% of outstanding home mortgages are below 5%, inventory will remain tight.

Mortgage rates to remain unchanged as June Inflation, Consumer Price Index (CPI), for 12 Month rose to 2.7% from 2.4% in May.  However, Wholesale Inflation, Producer Price Index (PPI), for 12 months fell from 2.7% in May to 2.3% in June.  Wholesale Prices often predict the direction of Consumer Prices.

30 year Mortgage rate for June averaged 6.75%.  Today’s mortgage rate is 6.81% (Mortgage News Daily). 

To view data for every Essex County town,

Essex County Housing Report May 2025, 6/25/2025

Essex County Housing Report May 2025, 6/25/2025

Bottom Line:Consumer Price Index (CPI) continues to improve which will translate into lower interest rates.

May’s 12 Month CPI rose 2.4% and CORE Inflation (CPI less food and energy) rose 2.8%. 
Monthly CPI and Monthly CORE Inflation each rose only 0.1%.  
30 year Mortgage rate for May averaged 6.89%.  Today’s mortgage rate is 6.79% (Mortgage News Daily). 

As we moved into our selling season, Units Sold and Median Sold Price rose both year over year and month over month for Single Families, Condos and 2-4 Unit Multi-families.  As expected, inventory also rose for these same property types.  The market still favors sellers as inventory remains around 2 months. A  balanced market has 6 months of inventory.

 To view data for every Essex County town,